


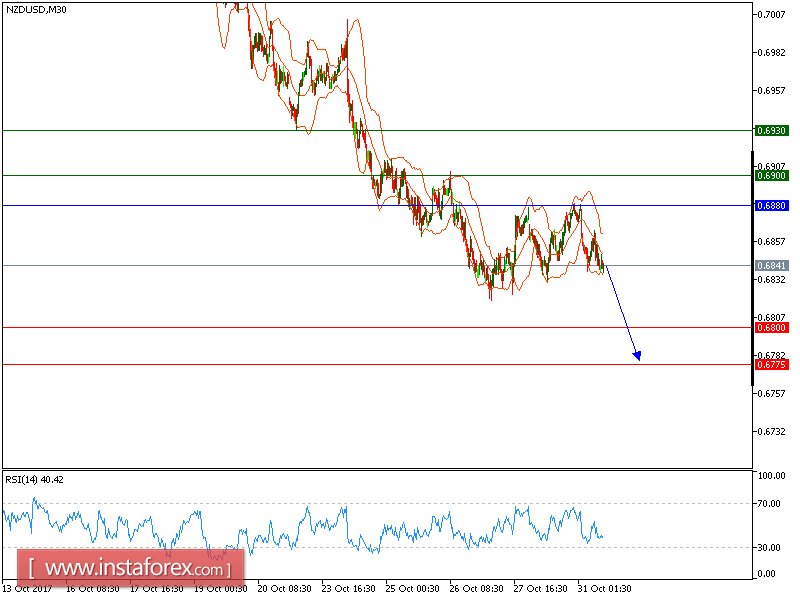
NZD/USD is expected to trade with bearish outlook. The pair has failed to post a sustainable rebound while being capped by the key resistance at 0.6880. Currently, it is trading around the overlapping 20-period and 50-period moving averages. The 20-period moving average has crossed back below the 50-period one, helping to maintain the bearish intraday outlook.
As long as the key resistance at 0.6880 is not surpassed, the pair stands a higher chance of returning to 0.6800 before sinking further to 0.6775.
The black line is showing the pivot point. Currently, the price is above the pivot point, which indicates long positions. If it remains below the pivot point, it will indicate short positions. The red lines are showing the support levels and the green line is indicating the resistance levels. These levels can be used to enter and exit trades.
Resistance levels: 0.6900, 0.6930, and 0.6965
Support levels: 0.6800, 0.6775, and 0.6735


