


The pair once again is setting the bullish tone above the 200 SMA at H1 chart and remains trapped in a range across the board. According to our short-term projections, we're expecting that GBP/USD reaches the resistance zone of 1.3309, at which could be offered to re-test the moving average mentioned above. If it manages to break such area, a leg lower towards the 1.3037 level is expected.
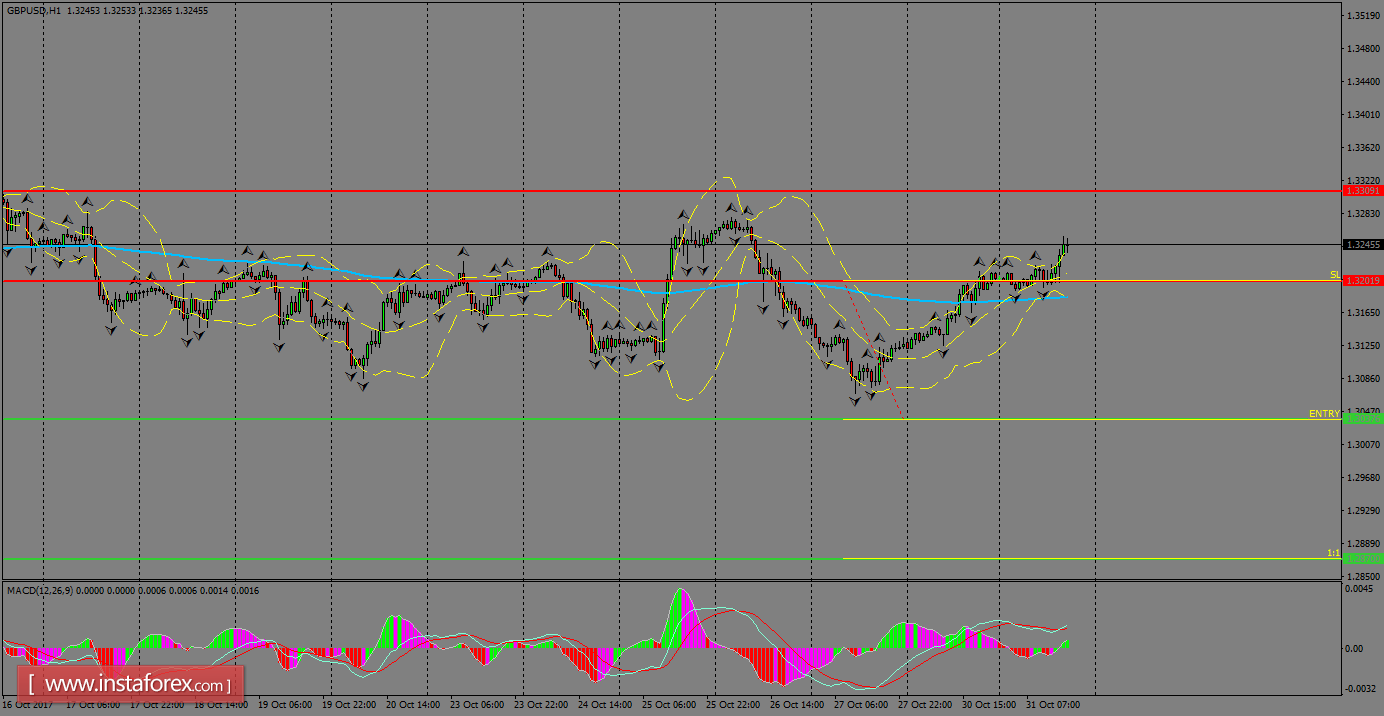
H1 chart's resistance levels: 1.3201 / 1.3309
H1 chart's support levels: 1.3037 / 1.2870
Trading recommendations for today: Based on the H1 chart, sell (short) orders only if the GBP/USD pair breaks a bearish candlestick; the support level is at 1.3037, take profit is at 1.2870 and stop loss is at 1.3201.


