Main Quotes Calendar Forum
flag

FX.co ★ Ichimoku indicator analysis of gold for November 1, 2017

parent
Forex Analysis:::2017-11-01T07:53:38

Ichimoku indicator analysis of gold for November 1, 2017

Gold has broken out of the downward sloping wedge pattern and yesterday it pulled back to back test the breakout area. Price made a higher low so far, but the short-term trend remains bearish as long as the price is below the Kumo.
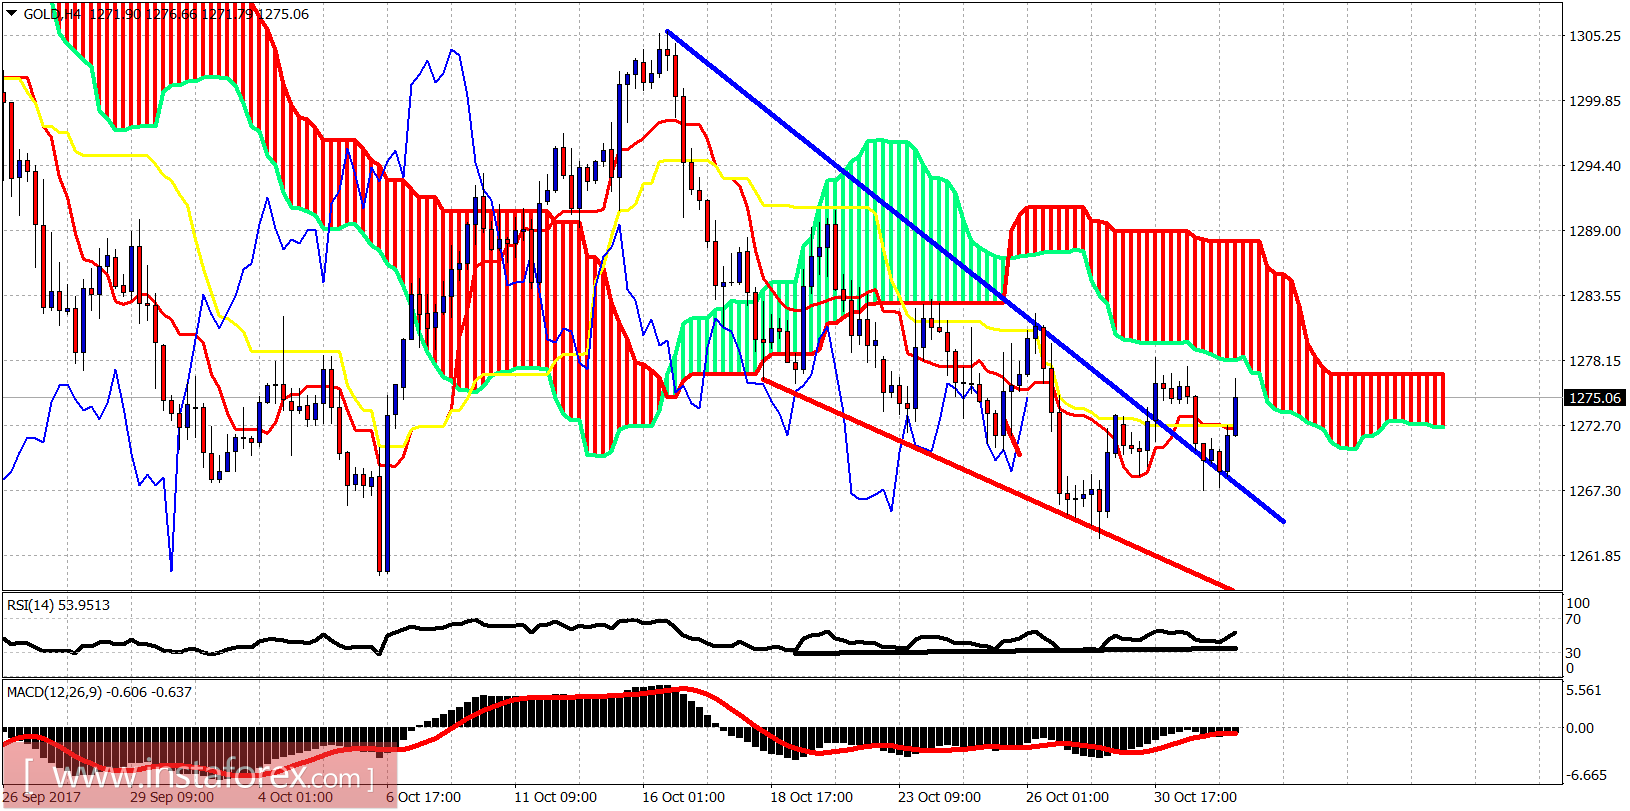
Ichimoku indicator analysis of gold for November 1, 2017

Blue line - resistance

Red line - support

The Gold price is trading below the 4 hour Kumo (cloud) resistance. This resistance is at $1,279-83. Support is at $1,267. Breaking below support will open the way for a move lower towards $1,260 or even lower.

Ichimoku indicator analysis of gold for November 1, 2017

On a daily basis, the trend remains bearish. Gold price is testing the tenklan-sen indicator. Bulls must break above it and try a push inside the cloud to change trend to neutral. Otherwise, we are still in danger of moving lower towards $1,240-50. I remain longer-term bullish.
Analyst InstaForex
Share this article:
parent
loader...
all-was_read__icon
You have watched all the best publications
presently.
We are already looking for something interesting for you...
all-was_read__star
Recently published:
loader...
More recent publications...