


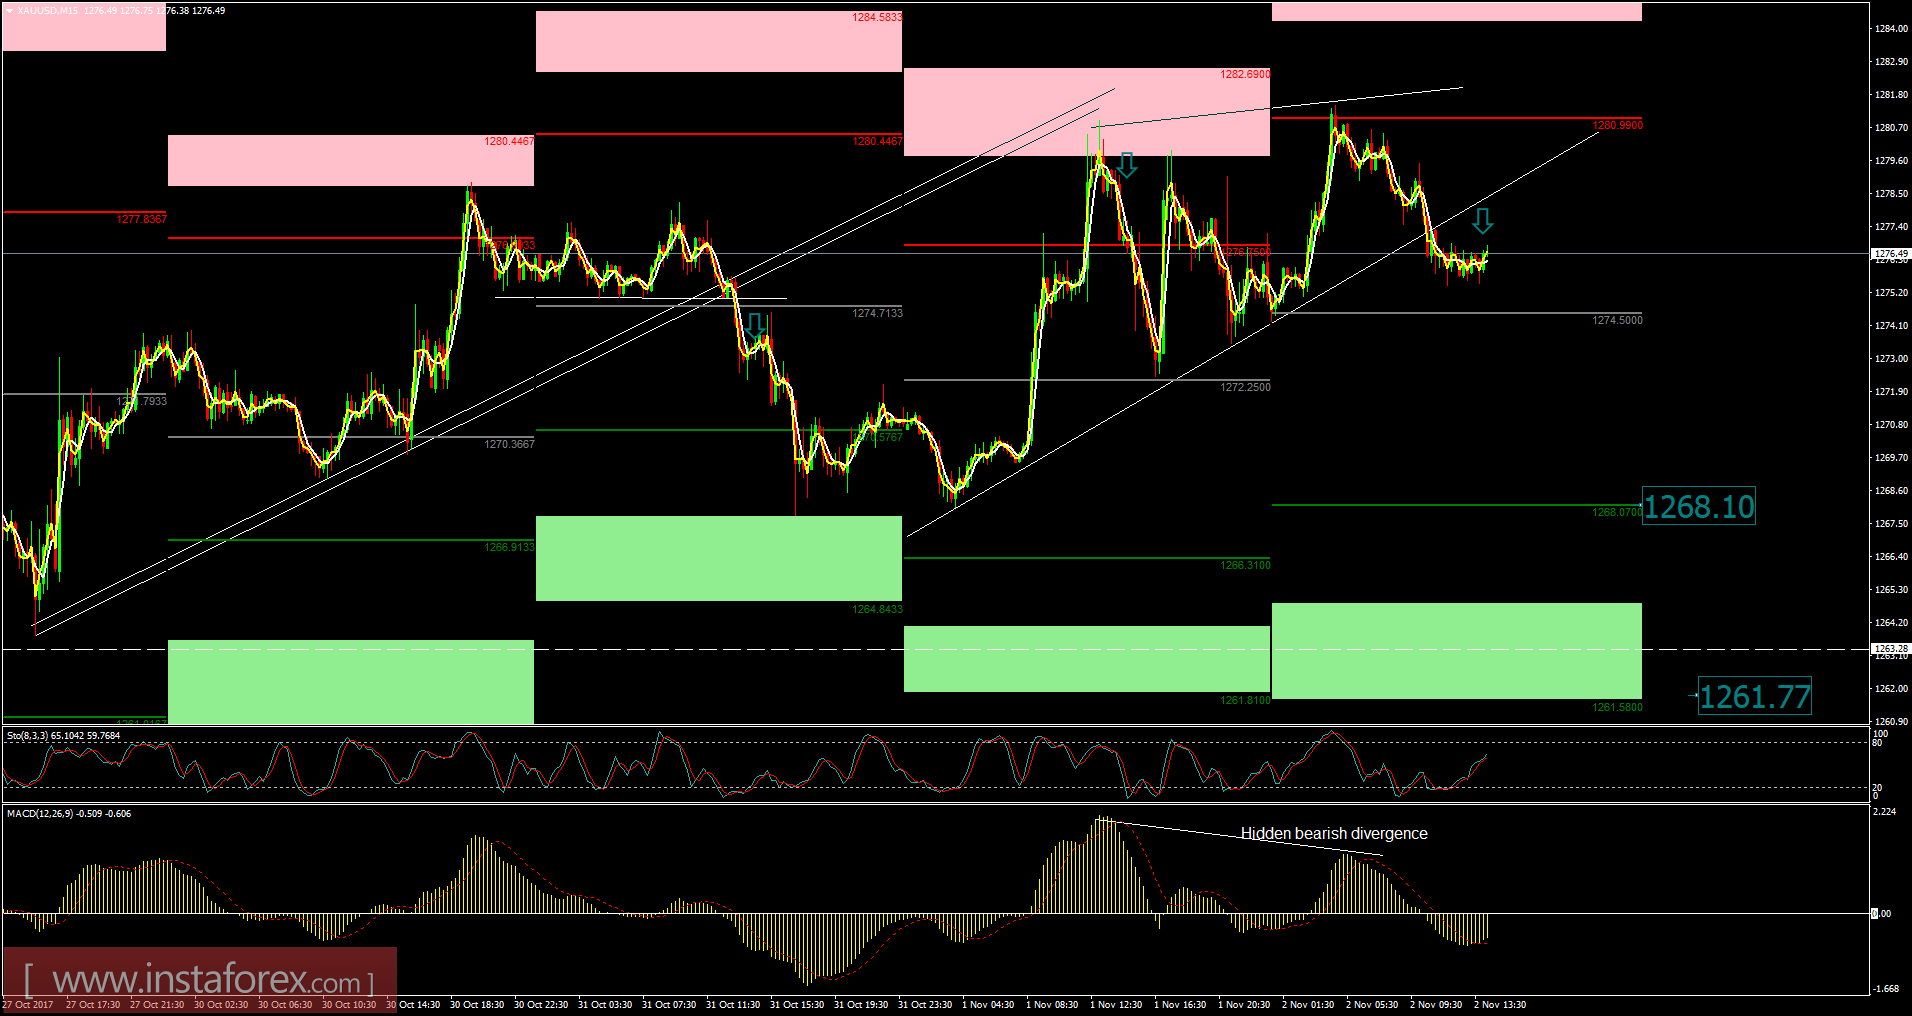
Recently, the Gold has been trading sideways at the price of $1,276.20. According to the 15M time - frame, I found broken upward trendline in the background, which is a sign that buying looks risky. I also found a hidden bearish divergence on the MACD oscillator, which is another sign of weakness. My advice is to watch for potential selling opportunities. The downward targets are set at the price of $1,268.00 (pivot support 1) and at the price of $1,261.80 (pivot support 2).
Resistance levels:
R1: $1,281.00
R2: $1,287.40
R3: $1.293.90
Support levels:
S1: $1,268.00
S2: $1,261.80
S3: $1,255.15
Trading recommendations for today: watch for potential selling opportunities.


