Main Quotes Calendar Forum
flag

FX.co ★ Ichimoku indicator analysis of gold for November 3, 2017

parent
Forex Analysis:::2017-11-03T07:51:06

Ichimoku indicator analysis of gold for November 3, 2017

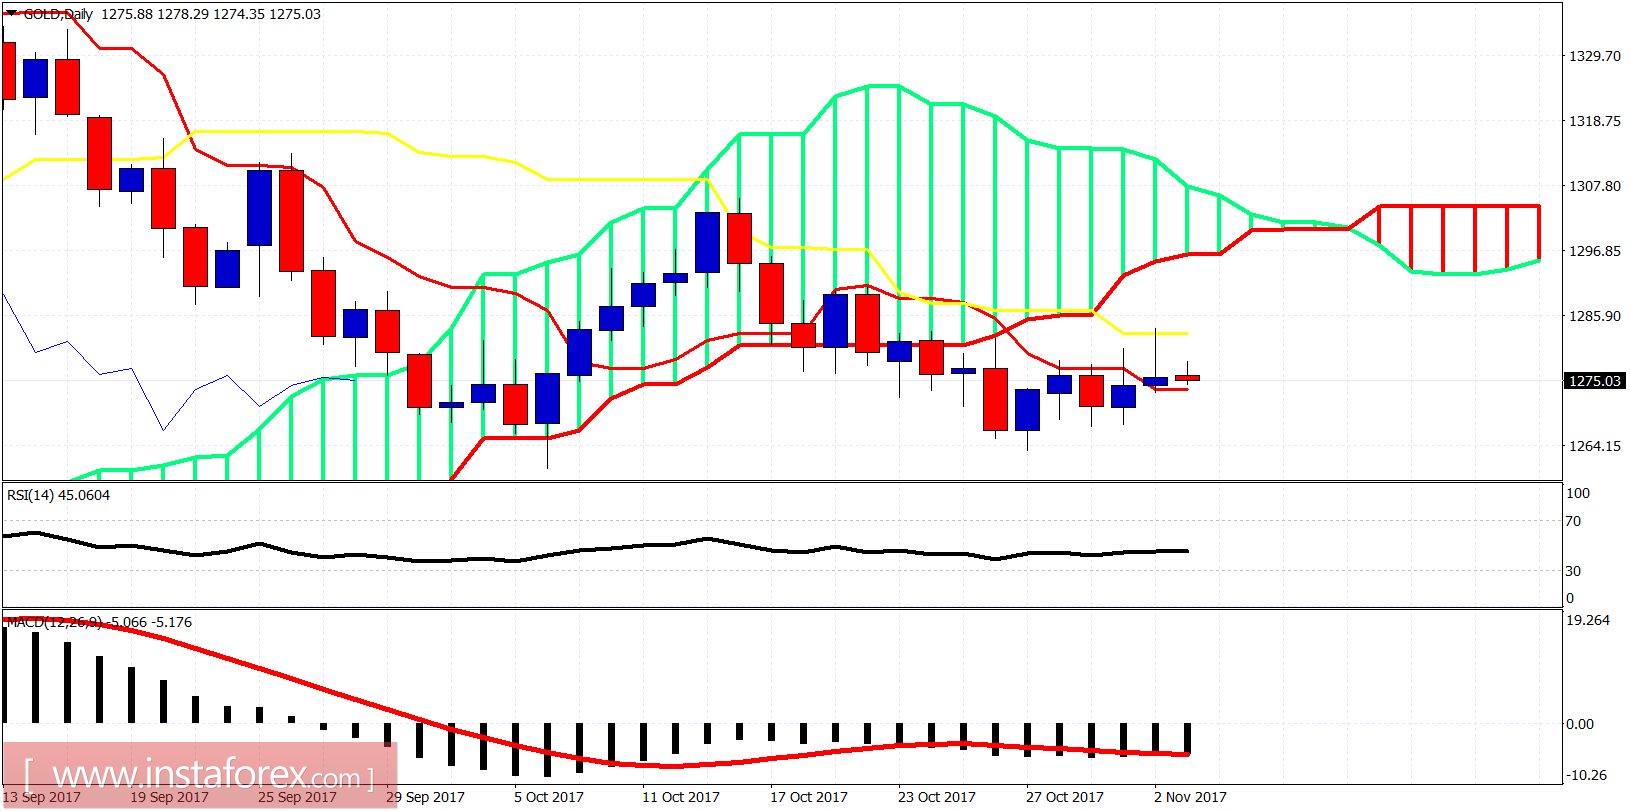
The Gold price has entered the Ichimoku cloud but is unable to clearly break above $1,283. The price got rejected at the resistance of $1,283 and is still in danger of moving towards $1,250-45.

Ichimoku indicator analysis of gold for November 3, 2017

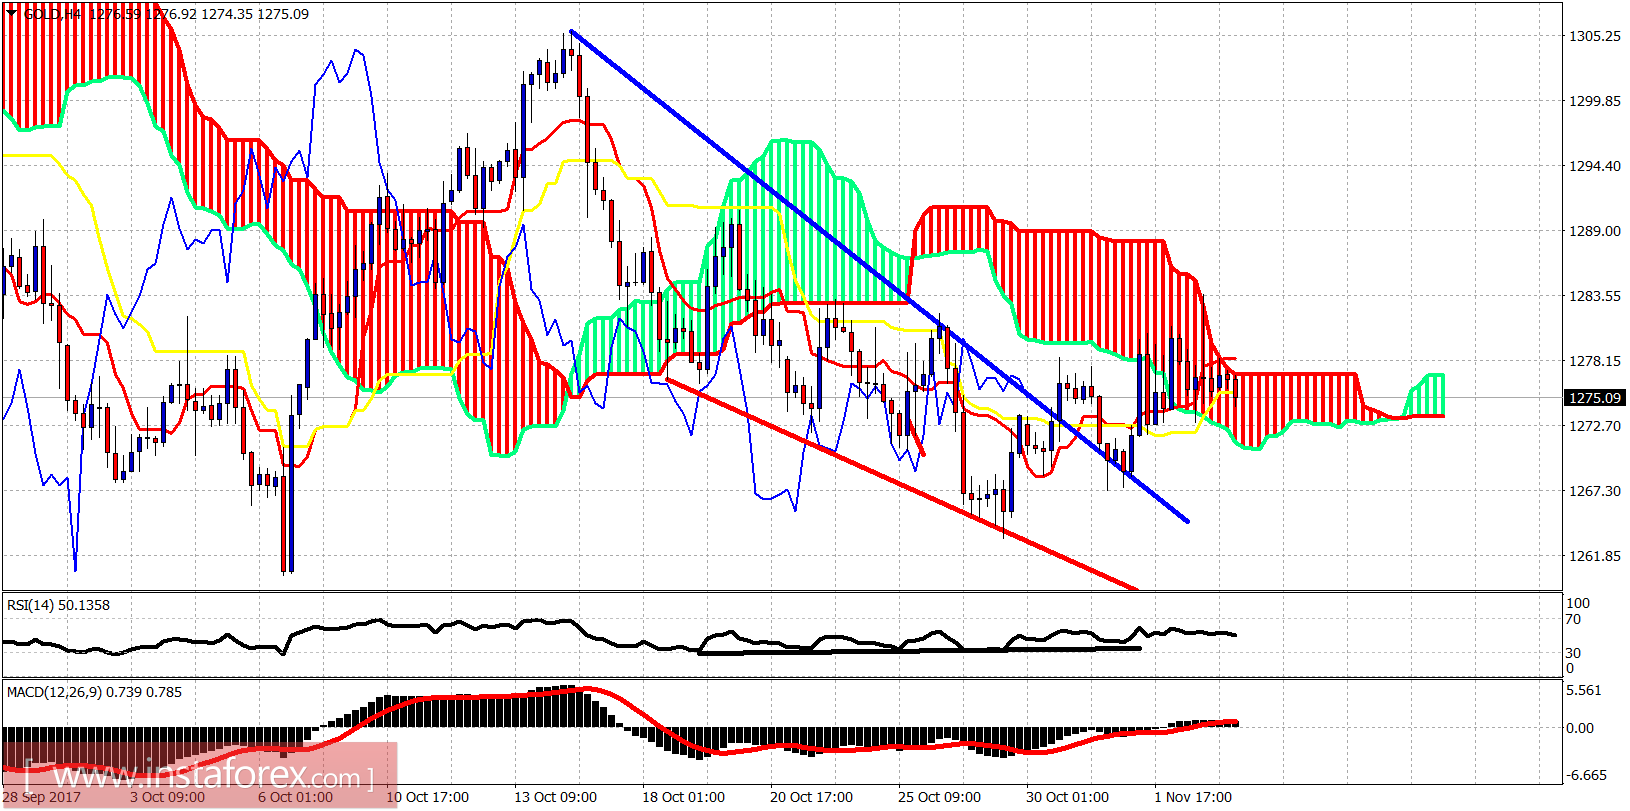
Blue line - resistance (broken)

Red line - support

The Gold price has entered the Ichimoku cloud. The trend is neutral. Short-term resistance remains at $1,283-84. Support is at $1,267. Breaking support will push the price towards $1,260-55. Breaking resistance will push the price towards $1,300-$1,310.

Ichimoku indicator analysis of gold for November 3, 2017

The Gold daily candle price is trading above the tenkan-sen (red line indicator). However, this is not enough for the bulls to be in control. The trend remains bearish on the daily chart. Resistance is at the kijun-sen (yellow line indicator) at $1,283. Next resistance is at the Kumo at $1,296. I remain longer-term bullish.
Analyst InstaForex
Share this article:
parent
loader...
all-was_read__icon
You have watched all the best publications
presently.
We are already looking for something interesting for you...
all-was_read__star
Recently published:
loader...
More recent publications...