


USD/JPY is expected to trade with a bullish outlook. Despite the pair posting a pullback, it is still supported by a bullish trend line. A support base at 1.1635 has formed and has allowed for a temporary stabilization. The rising 50-period moving average is also playing a support role.
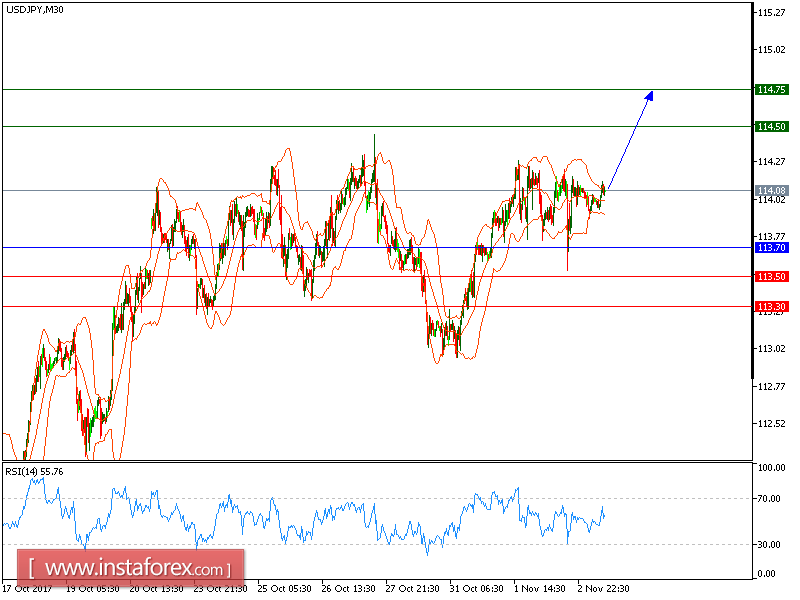
Hence, above 113.70, look for the continuation of rebound to 114.50 and even to 114.75 in extension.
Alternatively, if the price moves in the opposite direction, a short position is recommended above113.55 with a target at 113.30.
Chart Explanation: The black line shows the pivot point. The current price above the pivot point indicates a bullish position, while the price below the pivot point is a signal for a short position. The red lines show the support levels and the green line indicates the resistance level. These levels can be used to enter and exit trades.
Strategy: BUY, Stop Loss: 113.70, Take Profit: 114.50
Resistance levels: 114.30, 114.75 and 114.90 Support Levels: 113.50, 113.30, 113.00


