Main Quotes Calendar Forum
flag

FX.co ★ Ichimoku indicator analysis of USDX for November 6, 2017

parent
Forex Analysis:::2017-11-06T08:07:08

Ichimoku indicator analysis of USDX for November 6, 2017

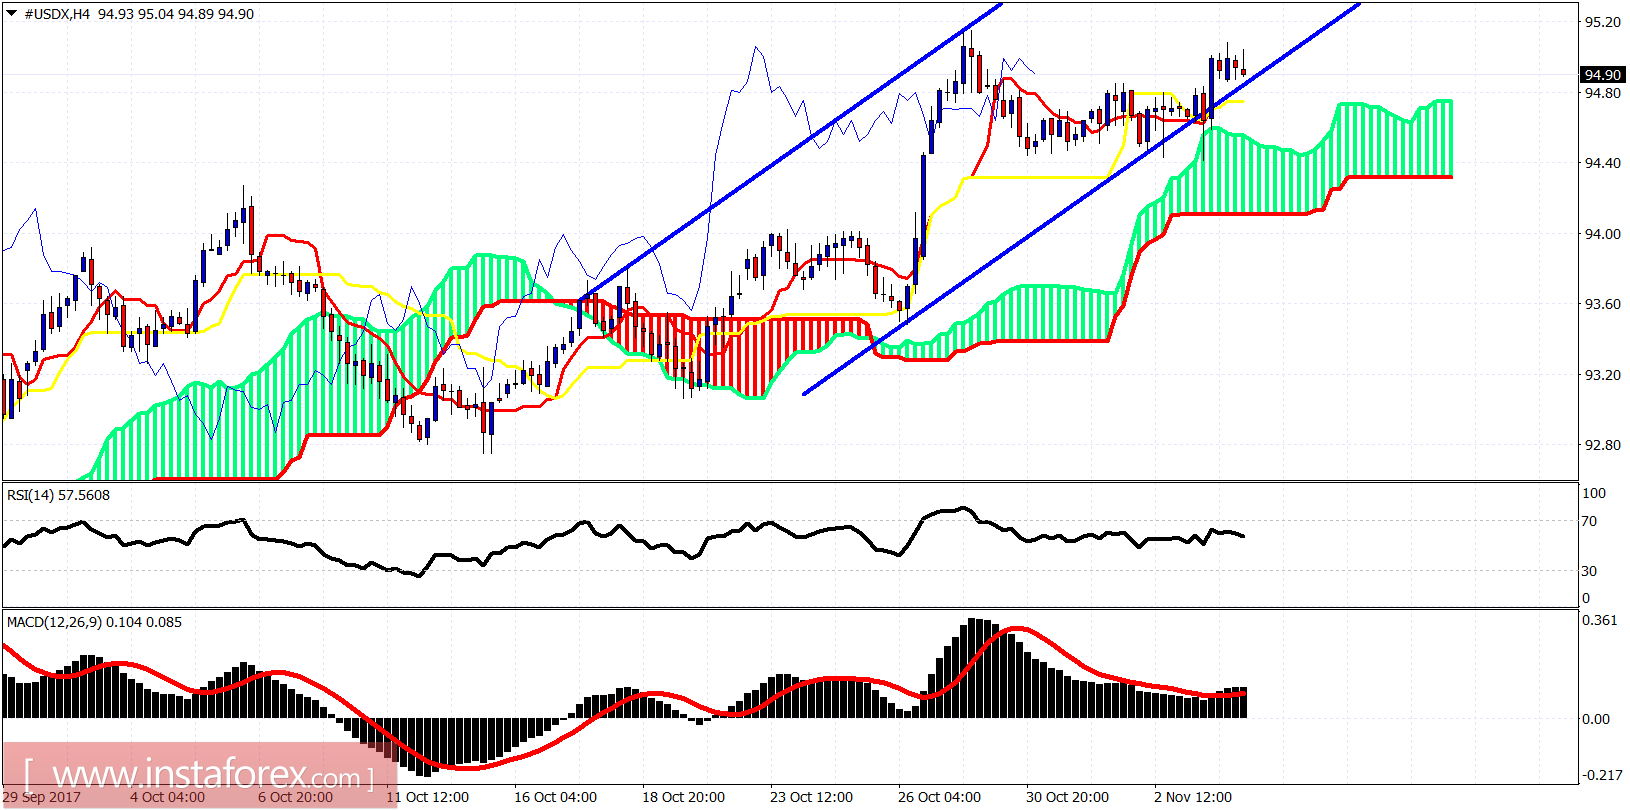
The dollar index marginally broke below the bullish channel last week but price held above the 4 hour Ichimoku cloud support. The trend remains bullish targeting towards 95.50.

Ichimoku indicator analysis of USDX for November 6, 2017

Blue lines - bullish channel

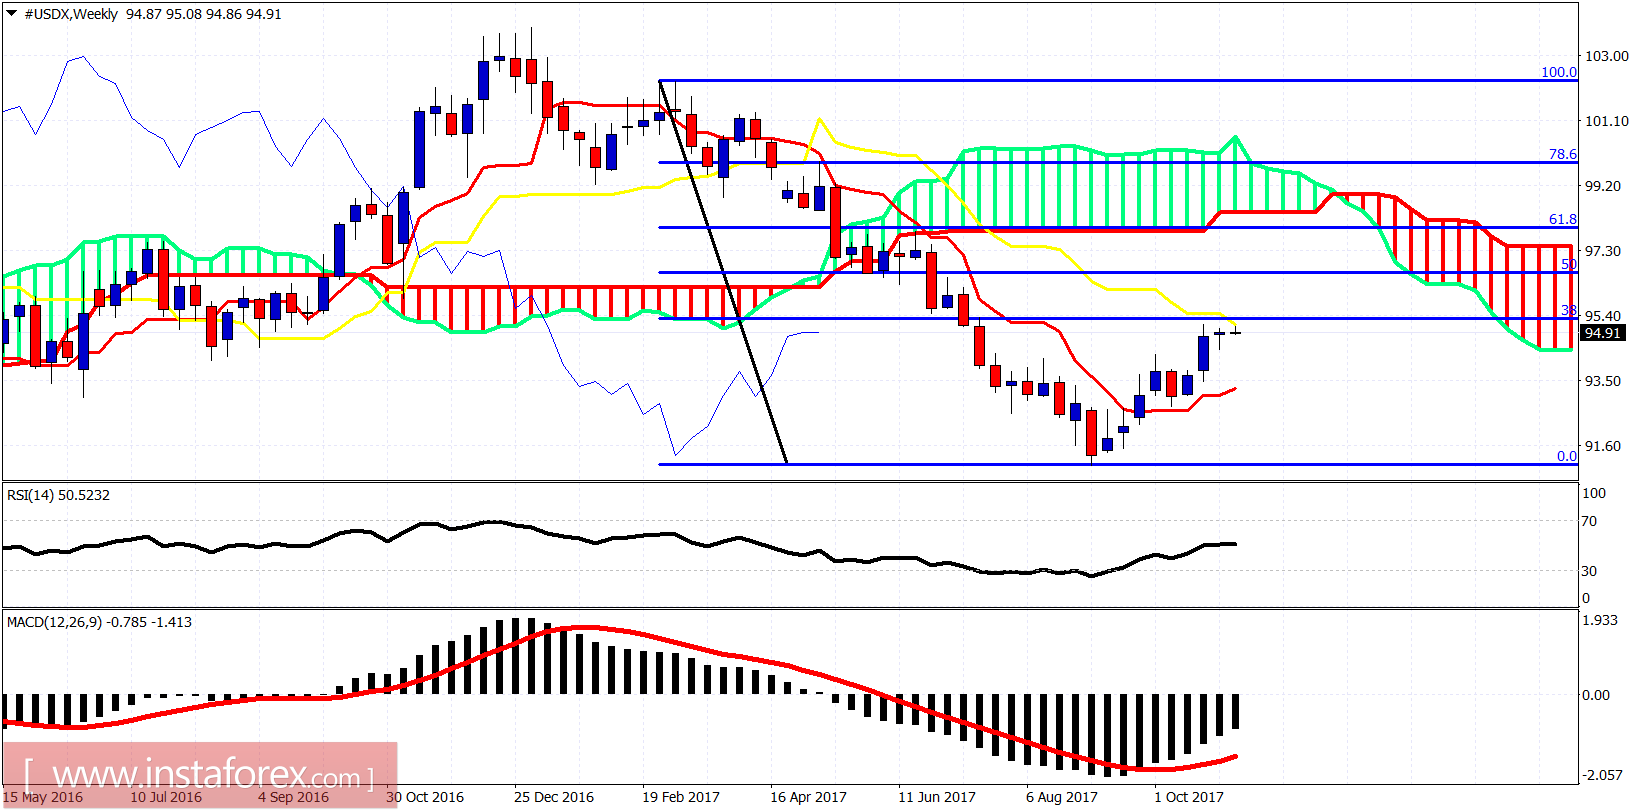
The dollar index is trading above the Kumo (cloud). The trend remains bullish. Support is at 94.75-94.50 and the next one is found at 94.10. As long as the price is above that levels, we should continue to expect the extension of this upward move towards 95.50-96.

Ichimoku indicator analysis of USDX for November 6, 2017

On a weekly basis nothing has changed. Price is heading towards our 1st target of the 38% Fibonacci retracement where we also find the kijun-sen (yellow line indicator). Important weekly support is at 93.30 and bears must break that level in order to have a confirmation for the resumption of the bearish trend.
Analyst InstaForex
Share this article:
parent
loader...
all-was_read__icon
You have watched all the best publications
presently.
We are already looking for something interesting for you...
all-was_read__star
Recently published:
loader...
More recent publications...