


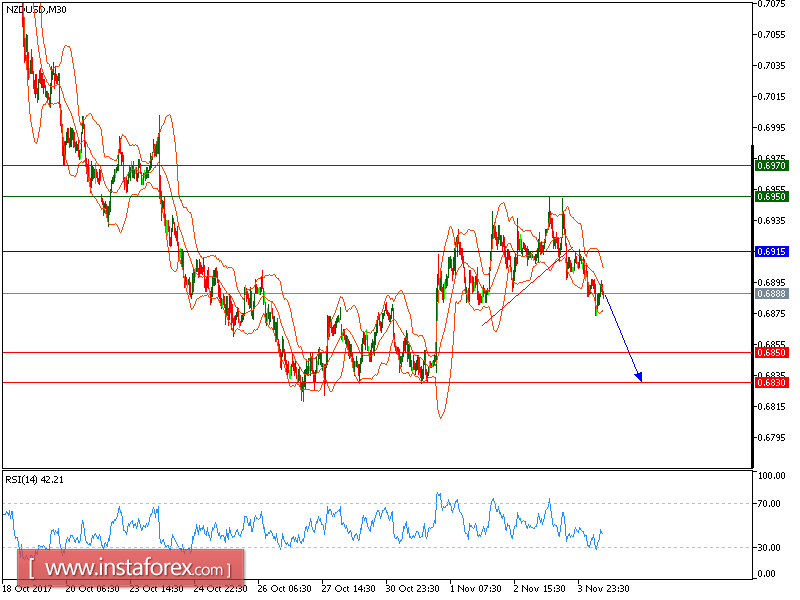

NZD/USD is under pressure and expected to continue the downside movement. The technical outlook for the pair is bearish as the prices broke below the rising trend line since November 1. The 20-period moving average crossed below the 50-period one. The relative strength index is below its neutrality level at 50.
To conclude, as long as 0.6915 is resistance, look for another decline with targets at 0.6850 and 0.6830 in extension.
The black line shows the pivot point. Currently, the price is above the pivot point, which indicates long positions. If it remains below the pivot point, it will indicate short positions. The red lines are showing the support levels and the green line is indicating the resistance levels. These levels can be used to enter and exit trades.
Resistance levels: 0.6950, 0.6970, and 0.6995
Support levels: 0.6850, 0.6830, and 0.6800


