


The index stays alive in the bullish bias held since last week above the 200 SMA at H1 chart. The nearest resistance is placed at the 95.14 level, where a break should expose the 95.85 level across the board. Currently, price action doesn't suggest further weakness in USDX, but a decline to test the 200 SMA is a possibility in coming hours.
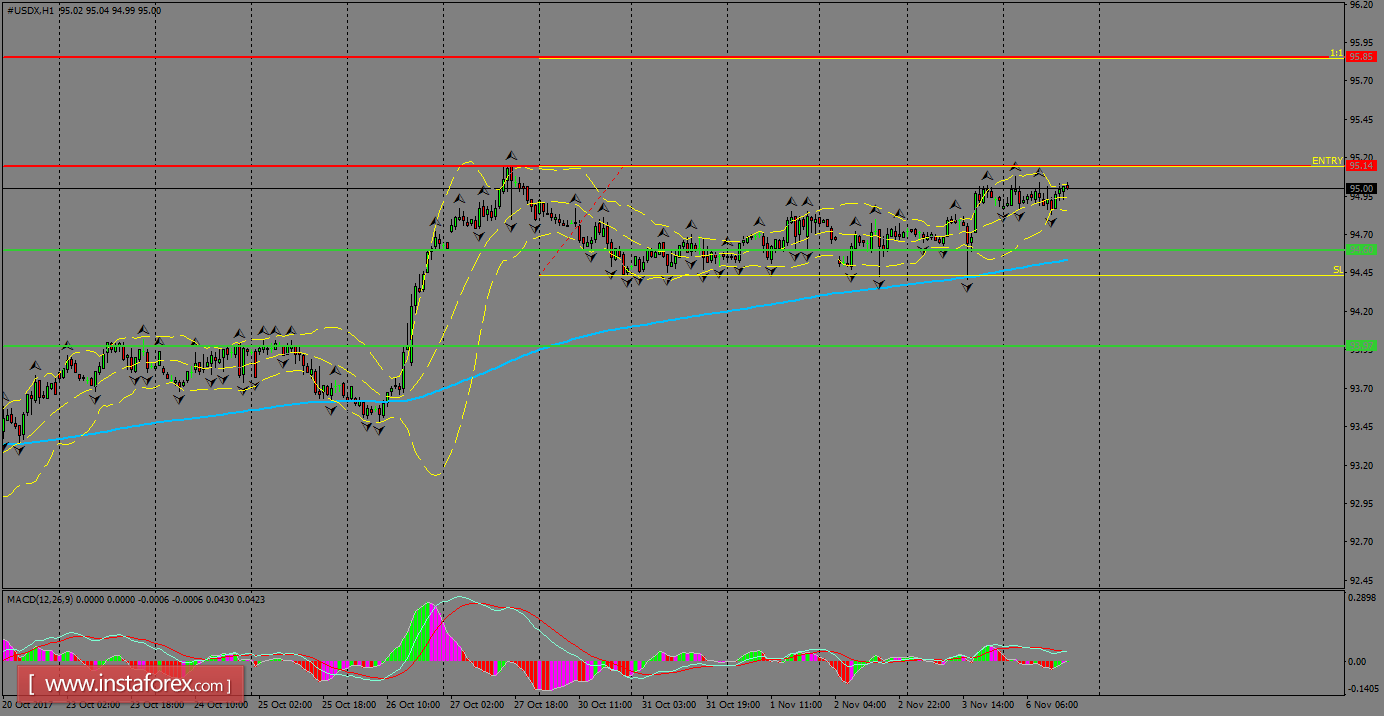
H1 chart's resistance levels: 95.14 / 95.85
H1 chart's support levels: 94.60 / 93.97
Trading recommendations for today: Based on the H1 chart, place buy (long) orders only if the USD Index breaks with a bullish candlestick; the resistance level is at 95.14, take profit is at 95.85 and stop loss is at 94.47.


