Main Quotes Calendar Forum
flag

FX.co ★ Ichimoku indicator analysis of USDX for November 7, 2017

parent
Forex Analysis:::2017-11-07T07:57:16

Ichimoku indicator analysis of USDX for November 7, 2017

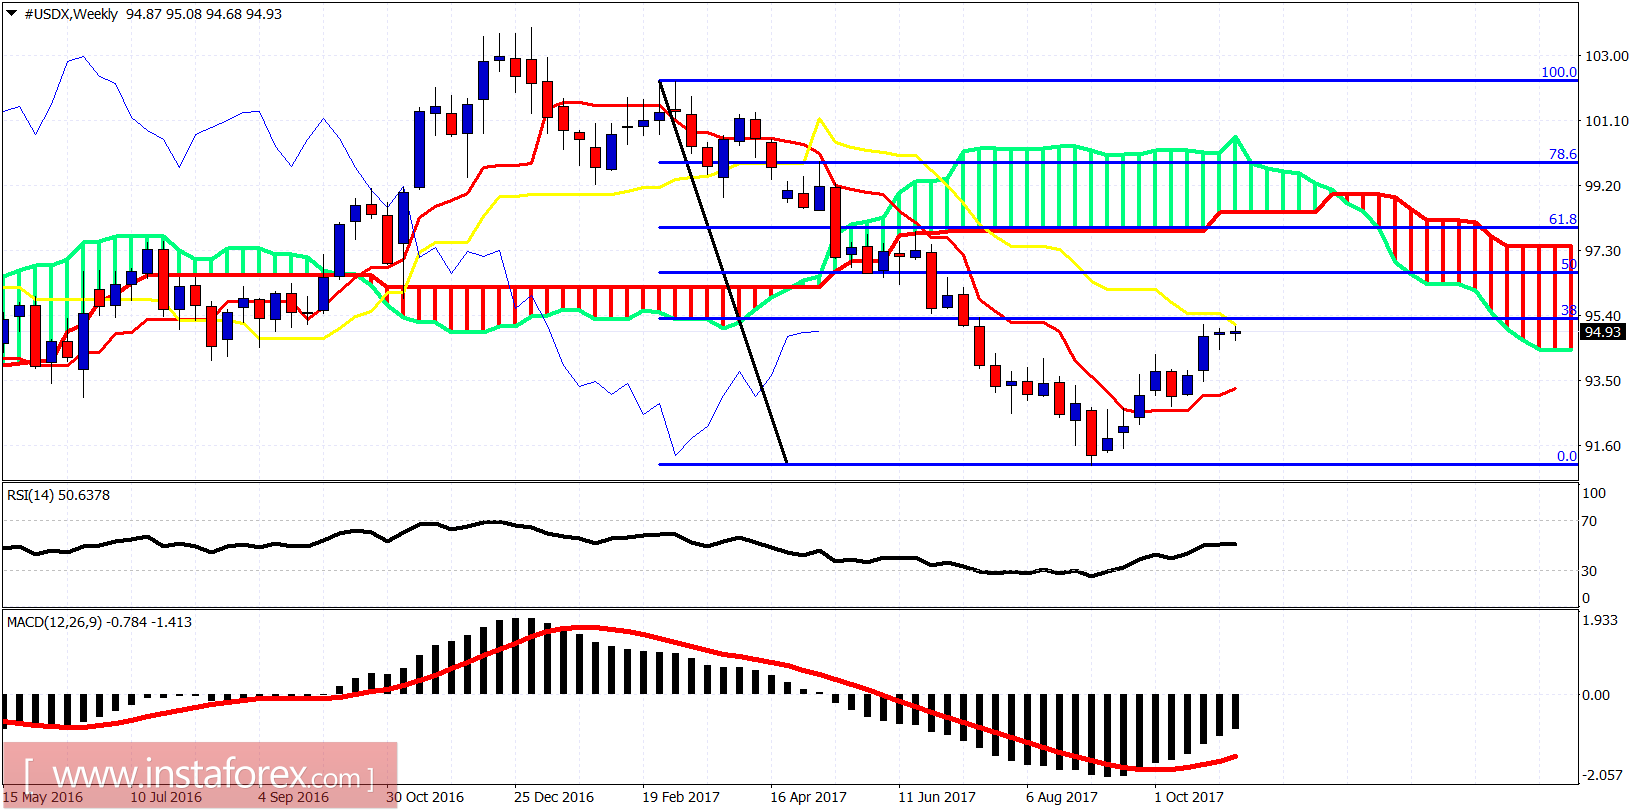
The Dollar index has broken out of the bullish channel but price remains above the Ichimoku cloud and has not broken below any previous low or important support. Price is mainly moving sideways.

Ichimoku indicator analysis of USDX for November 7, 2017

Blue lines - bullish channel

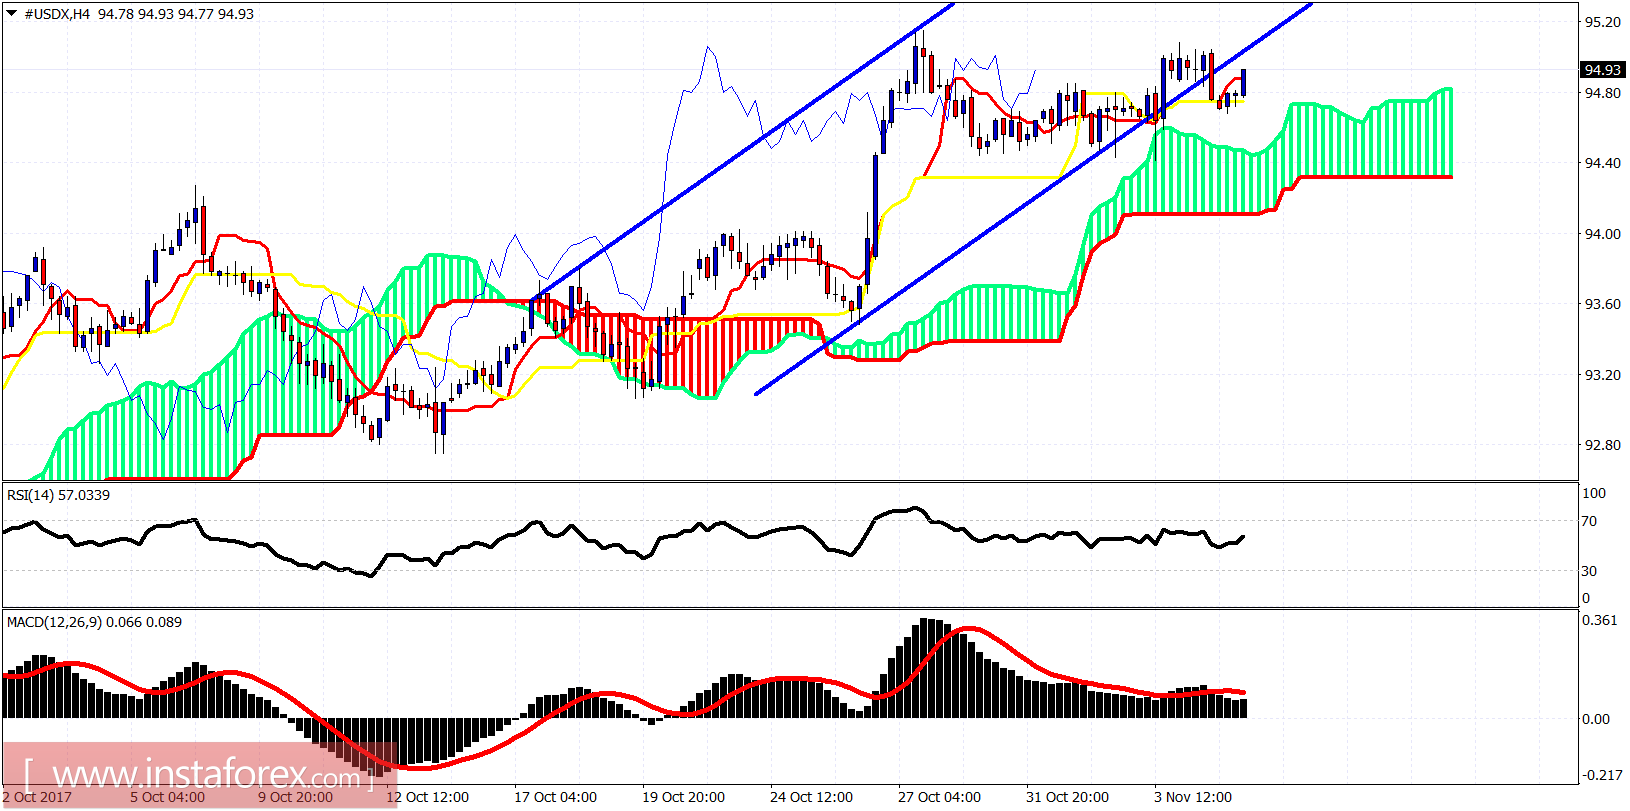
The Dollar index is above the 4-hour Kumo (cloud) support. Price has broken out of the bullish channel but no support level is broken. Trend remains bullish as long as price is above 94.10. Resistance is at 95.10. First support is at 94.40 and next and very important at 94.10.

Ichimoku indicator analysis of USDX for November 7, 2017

On a weekly basis, the Dollar index remains below the kijun-sen and the 38% Fibonacci retracement resistance. A rejection at current levels could push price lower towards the tenkan-sen at first at the 93.30 level. The Dollar index is in a corrective bounce phase. Once this is done, I expect the downtrend to resume towards 88.
Analyst InstaForex
Share this article:
parent
loader...
all-was_read__icon
You have watched all the best publications
presently.
We are already looking for something interesting for you...
all-was_read__star
Recently published:
loader...
More recent publications...