


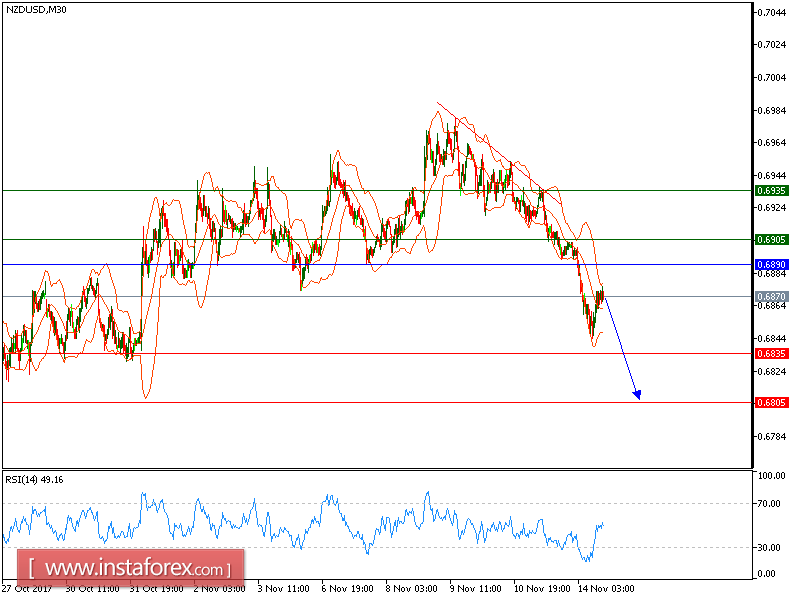
All our targets which we predicted in yesterday's analysis have been hit. NZD/USD is under pressure . The pair remains in a down trend, capped by its falling 20-period and 50-period moving averages. The horizontal key resistance at 0.6890 maintains the strong selling pressure on the prices. In addition, the relative strength index remains weak below its neutrality area at 50.
Therefore, as long as 0.6890 holds on the upside, the risk of a slide below 0.6835 remains high.
The black line shows the pivot point. Currently, the price is above the pivot point, which indicates long positions. If it remains below the pivot point, it will indicate short positions. The red lines are showing the support levels and the green line is indicating the resistance levels. These levels can be used to enter and exit trades.
Resistance levels: 0.6905, 0.6935, and 0.6975
Support levels: 0.6835, 0.6805, and 0.6765


