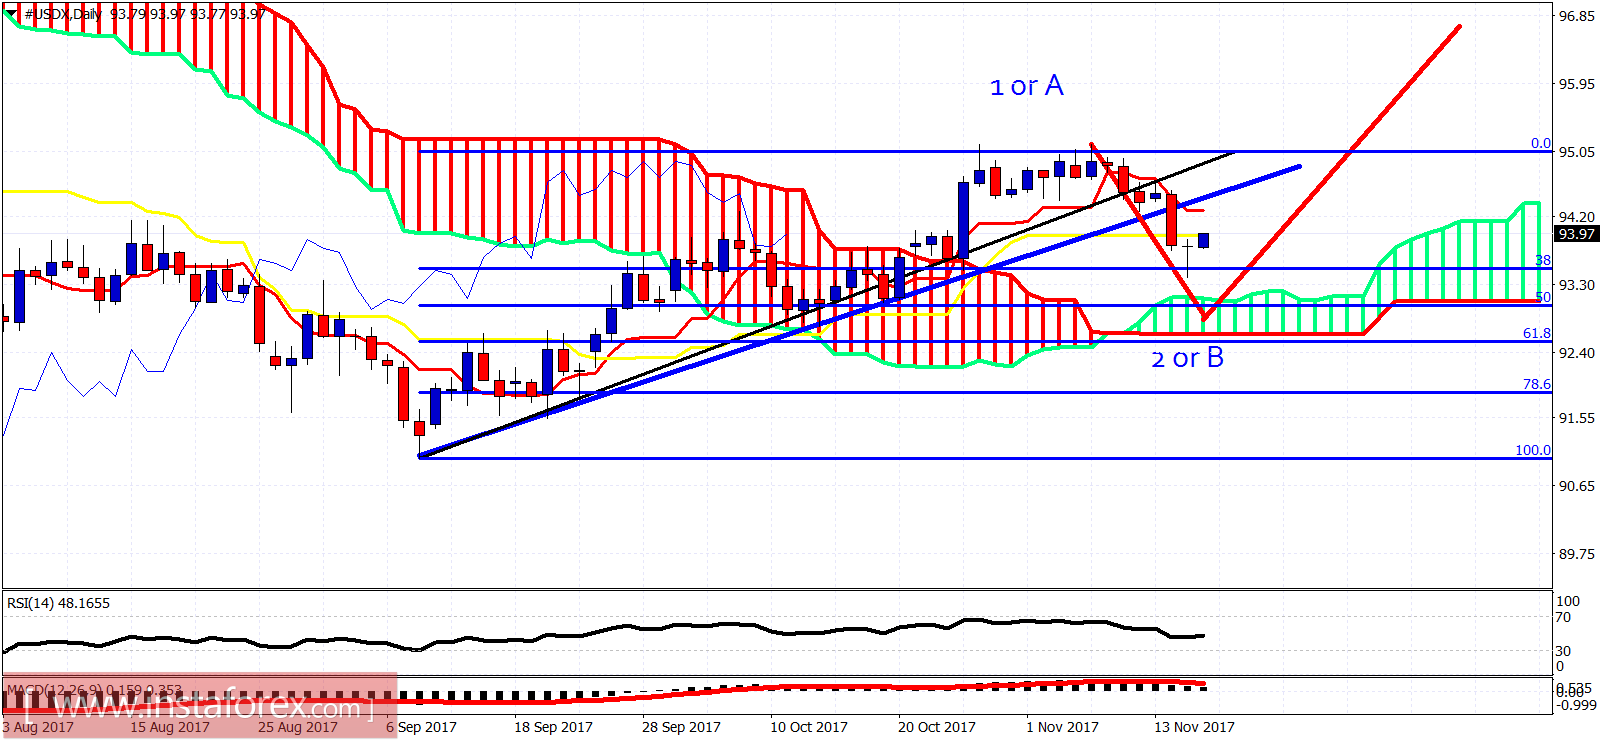
The Dollar index has made a reversal day yesterday. Price is bouncing off the 38% Fibonacci retracement and price action increases the chances of the two wave scenarios we posted yesterday.

Price is trading above the daily Ichimoku cloud. Price has reached the 38% Fibonacci level and is bouncing. Yesterday's candle formation was a doji star reversal pattern. Price could very well have ended wave 2 or wave B down. Support is at 93.10-92.65. Resistance is at 94.20-94.50.

On a weekly basis price has touched the weekly tenkan-sen (red line indicator) and bounced. Resistance is at 94.60. A break above that level will push price towards the recent highs again. A break above recent highs will push the index towards the 61.8% Fibonacci retracement and the weekly Kumo (cloud).


