


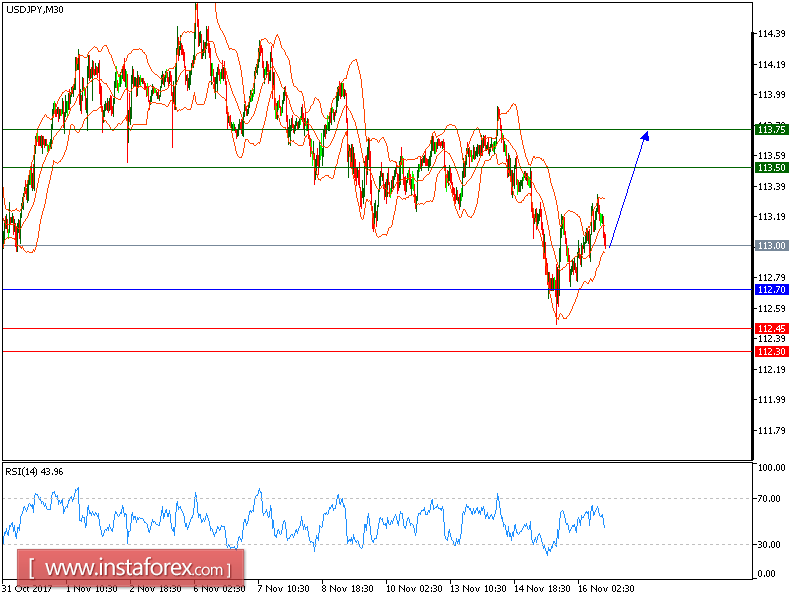
USD/JPY is expected to trade with a bullish outlook above 112.70. The pair is rebounding from 112.45. The bullish cross between 20-period and 50-period moving averages has been identified. The relative strength index advocates for a further upside.
Hence, as long as 112.70 holds on the upside, look for a return with targets at 113.50 and 113.75 in extension.
Alternatively, if the price moves in the opposite direction, a short position is recommended above 112.70 with a target at 112.45.
Chart Explanation: The black line shows the pivot point. The current price above the pivot point indicates a bullish position, while the price below the pivot point is a signal for a short position. The red lines show the support levels and the green line indicates the resistance level. These levels can be used to enter and exit trades.
Strategy: BUY, Stop Loss: 112.70, Take Profit: 113.50
Resistance levels: 113.50, 113.75 and 114.05 Support Levels: 112.45, 112.30, 112.00


