


The Gold price has once again reached the upper boundary of the short-term trading range it is in since late October. The price action, however, does not look impulsive so far as the form of the rise is full of overlapping three-wave structures. This implies that this upward move is part of a bigger downward correction.
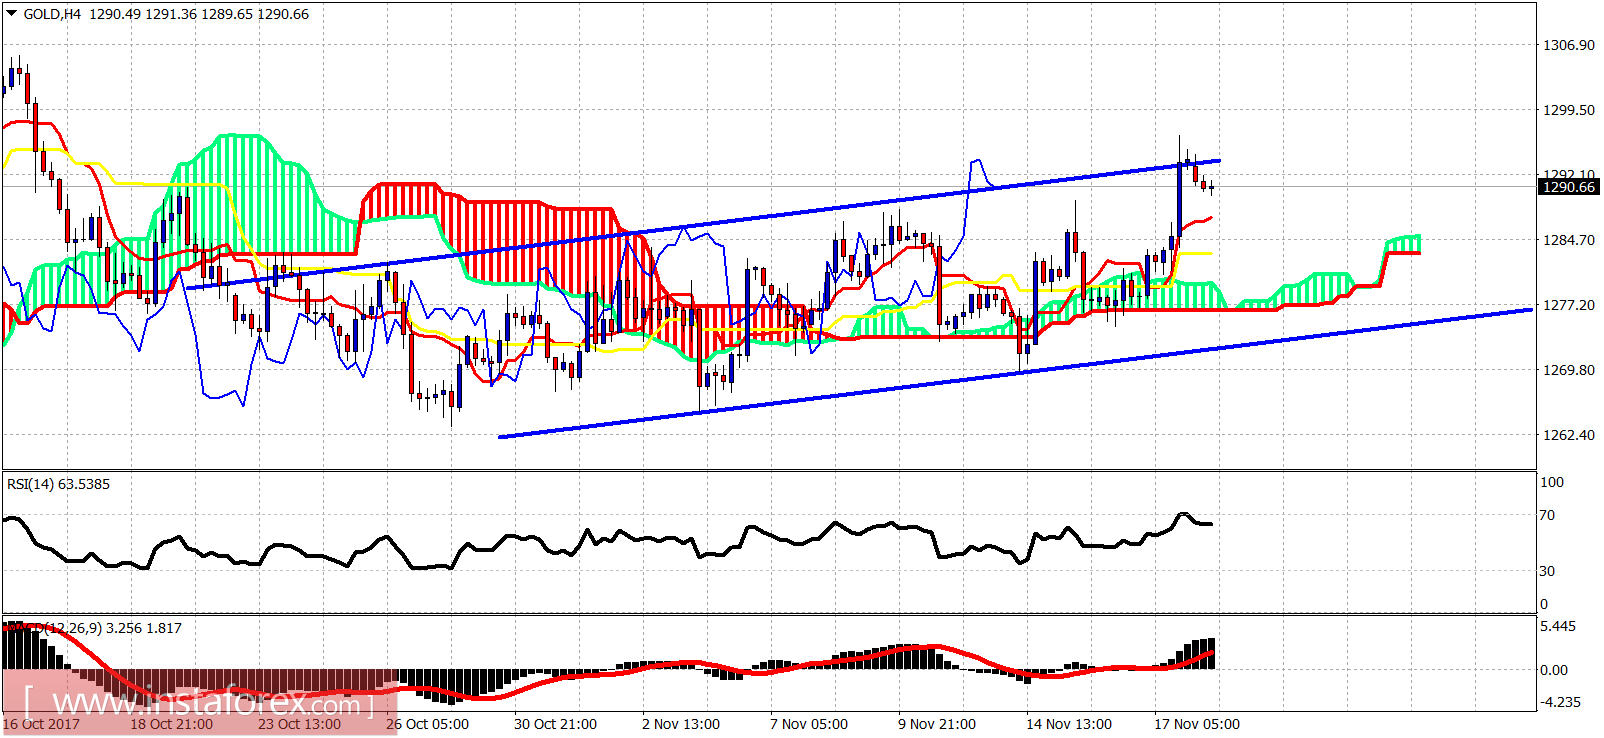
Blue lines - trading range
The Gold price has been making three-wave moves since late October lows. This is not a bullish sign. Support is at $1,277 and resistance at $1,294. Gold price could move towards $1,300 but I continue to believe that the downward correction from $1,350 is not over yet.
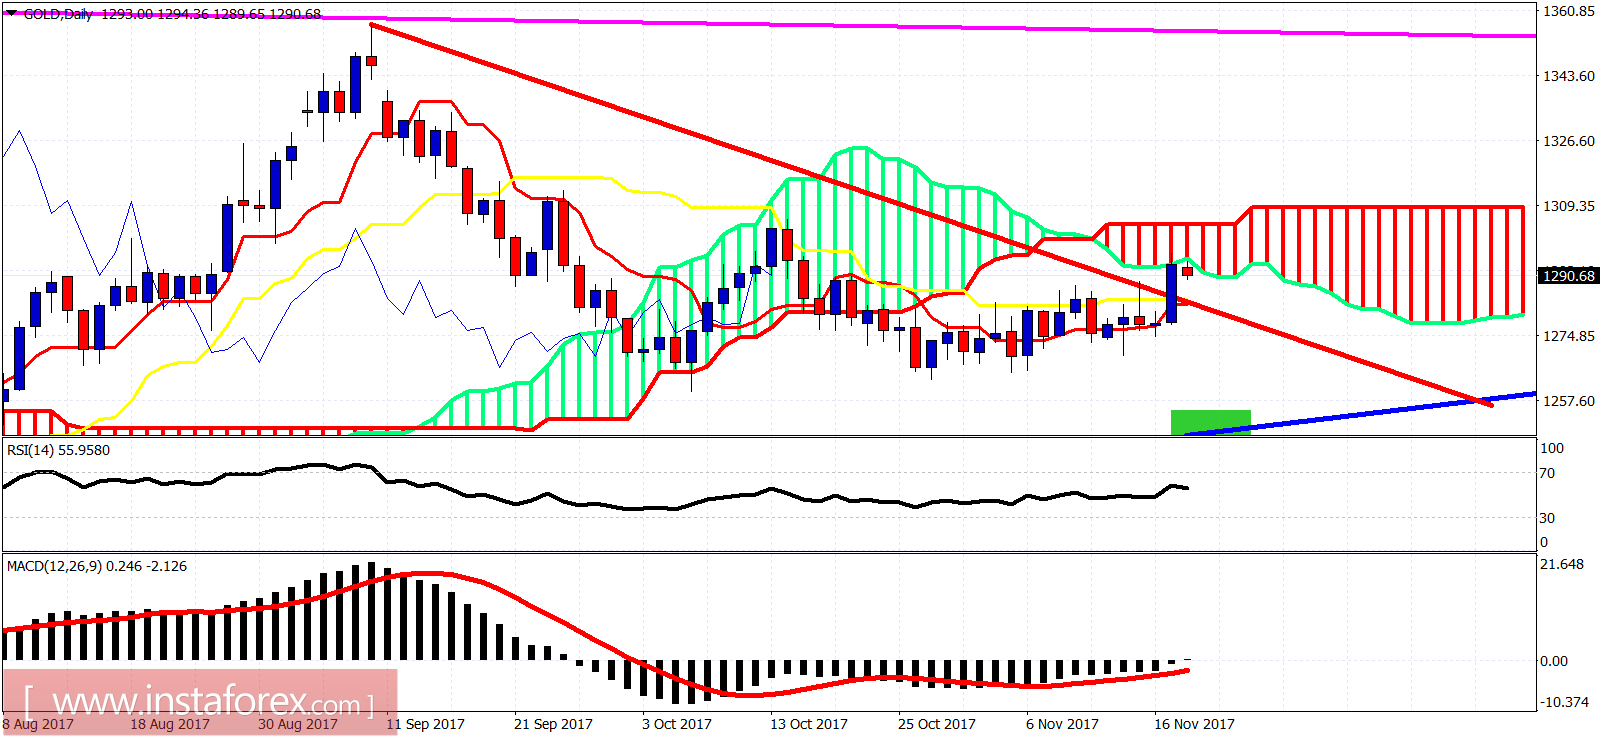
Red line - resistance
Blue line- support
Magenta line - long-term resistance
The Gold price has broken above both the tenkan- and kijun-sen indicators and the downward sloping red trend line. However, the most important resistance is the Daily cloud. A rejection here will support my view that a new low towards $1,250 is needed in order to complete the corrective phase.


