Main Quotes Calendar Forum
flag

FX.co ★ Ichimoku indicator analysis of USDX for November 22, 2017

parent
Forex Analysis:::2017-11-22T07:52:29

Ichimoku indicator analysis of USDX for November 22, 2017

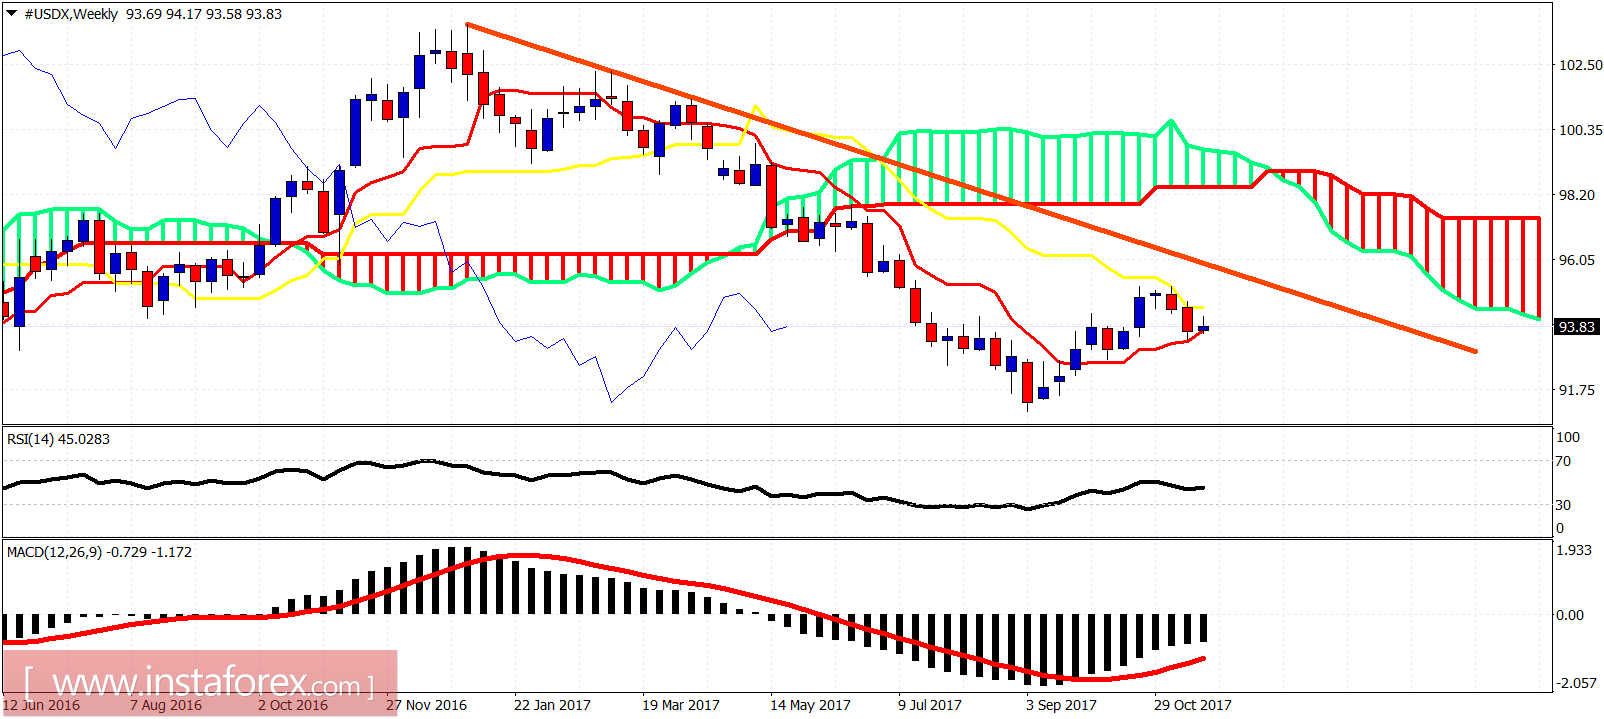
The Dollar index made new higher highs yesterday but price got rejected at the cloud resistance. We could see a new lower low towards 92.50-93 before starting the next leg up towards 97.

Ichimoku indicator analysis of USDX for November 22, 2017

Green rectangle - support area

Red rectangle - target if support area fails

The Dollar index bounced off the 38% Fibonacci retracement towards cloud resistance and got rejected. Price remains below the 4-hour Kumo (cloud) something that strengthens the bearish short-term trend. Breaking below the green rectangle support area will be a bearish sign. Price will be next going towards the red rectangular area.

Ichimoku indicator analysis of USDX for November 22, 2017

On a weekly basis, nothing has changed. Price is trapped between the kijun- and the tenkan-sen indicators. I believe the reversal from the 95 level when price got rejected at the kijun-sen, is only part of the upward bounce that started in September. I believe this upward corrective bounce is not over yet and we still have one more upward move towards 97 to finish the entire bounce.
Analyst InstaForex
Share this article:
parent
loader...
all-was_read__icon
You have watched all the best publications
presently.
We are already looking for something interesting for you...
all-was_read__star
Recently published:
loader...
More recent publications...