Main Quotes Calendar Forum
flag

FX.co ★ Ichimoku indicator analysis of gold for November 23, 2017

parent
Forex Analysis:::2017-11-23T08:10:50

Ichimoku indicator analysis of gold for November 23, 2017

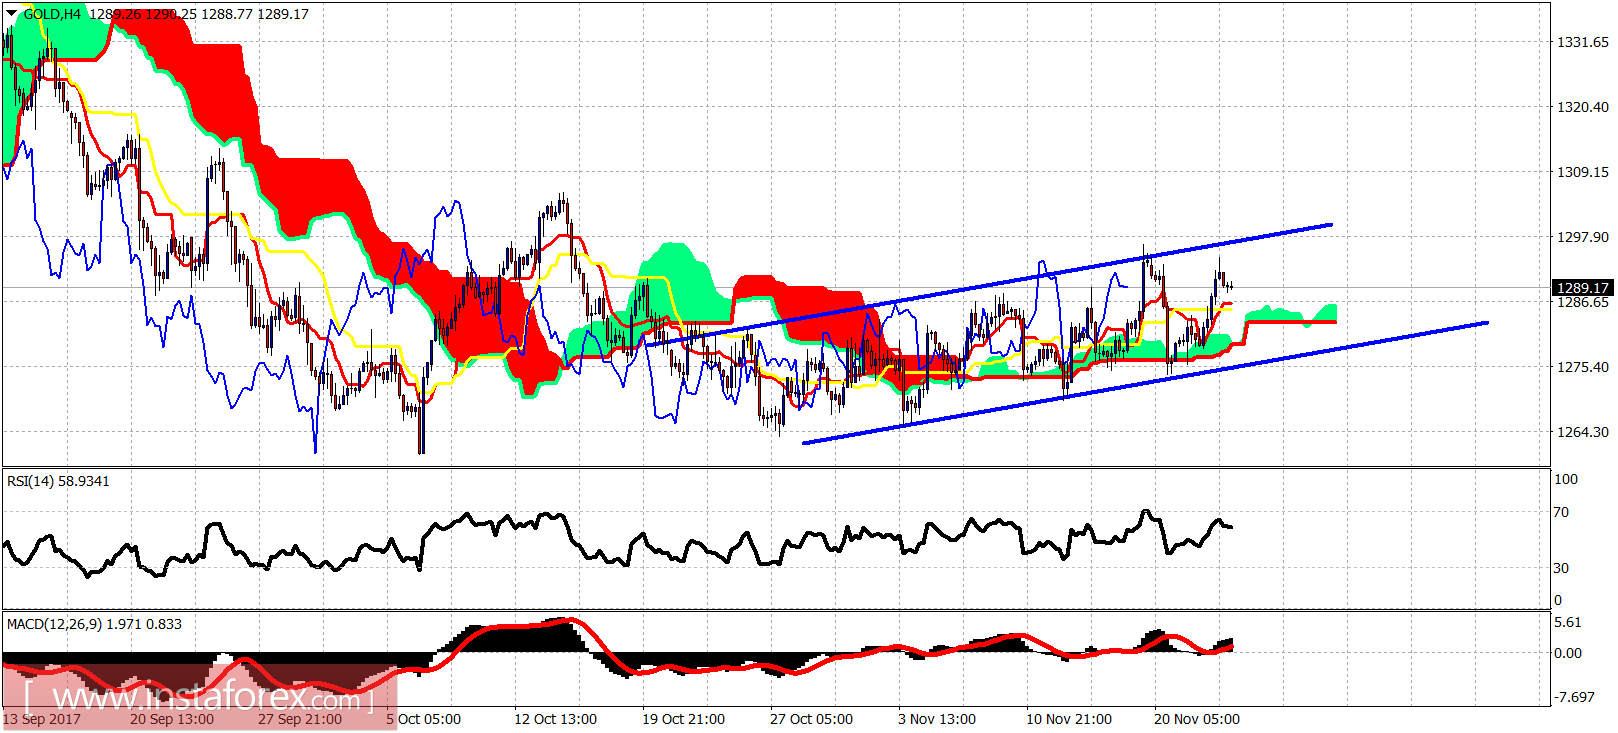
Gold price reached the upper channel boundary once again and it shows reversal signs. Price is trapped inside a trading range. Gold is expected to move towards $1,250 and that is why I remain short-term bearish.

Ichimoku indicator analysis of gold for November 23, 2017

Blue lines - trading range

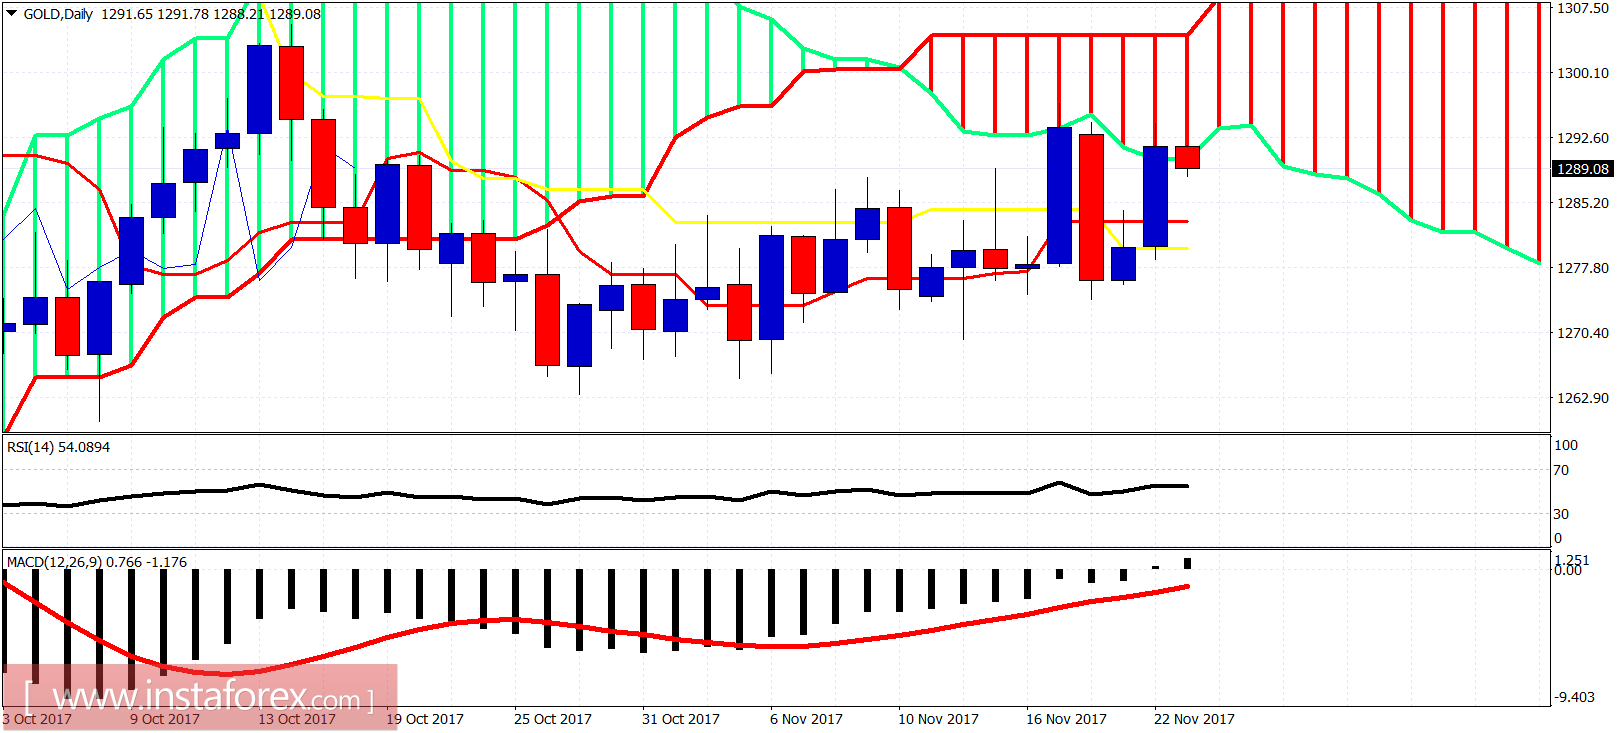
Gold price is trading above both the tenkan- and kijun-sen indicators. Support is at $1,285 and next at $1,276. Breaking below $1,276 will confirm that we are heading towards $1,250-40. Resistance is at $1,296. Breaking above it will push Gold price towards $1,310-15.

Ichimoku indicator analysis of gold for November 23, 2017

On a daily basis, Gold price reached the lower cloud boundary and is showing rejection signs. If price closes below the $1,280 level on a daily basis then the next leg down towards $1,250 will have started. Gold bulls need to close price above $1,293 in order to make a move towards next resistance at $1,305-$1,310.
Analyst InstaForex
Share this article:
parent
loader...
all-was_read__icon
You have watched all the best publications
presently.
We are already looking for something interesting for you...
all-was_read__star
Recently published:
loader...
More recent publications...