


The Dollar index got rejected at the 4-hour Kumo and is making new lower lows below the short-term support area of 93.50-93.40. Trend remains bearish and we should expect price to bounce and make a lower low towards 92.50.
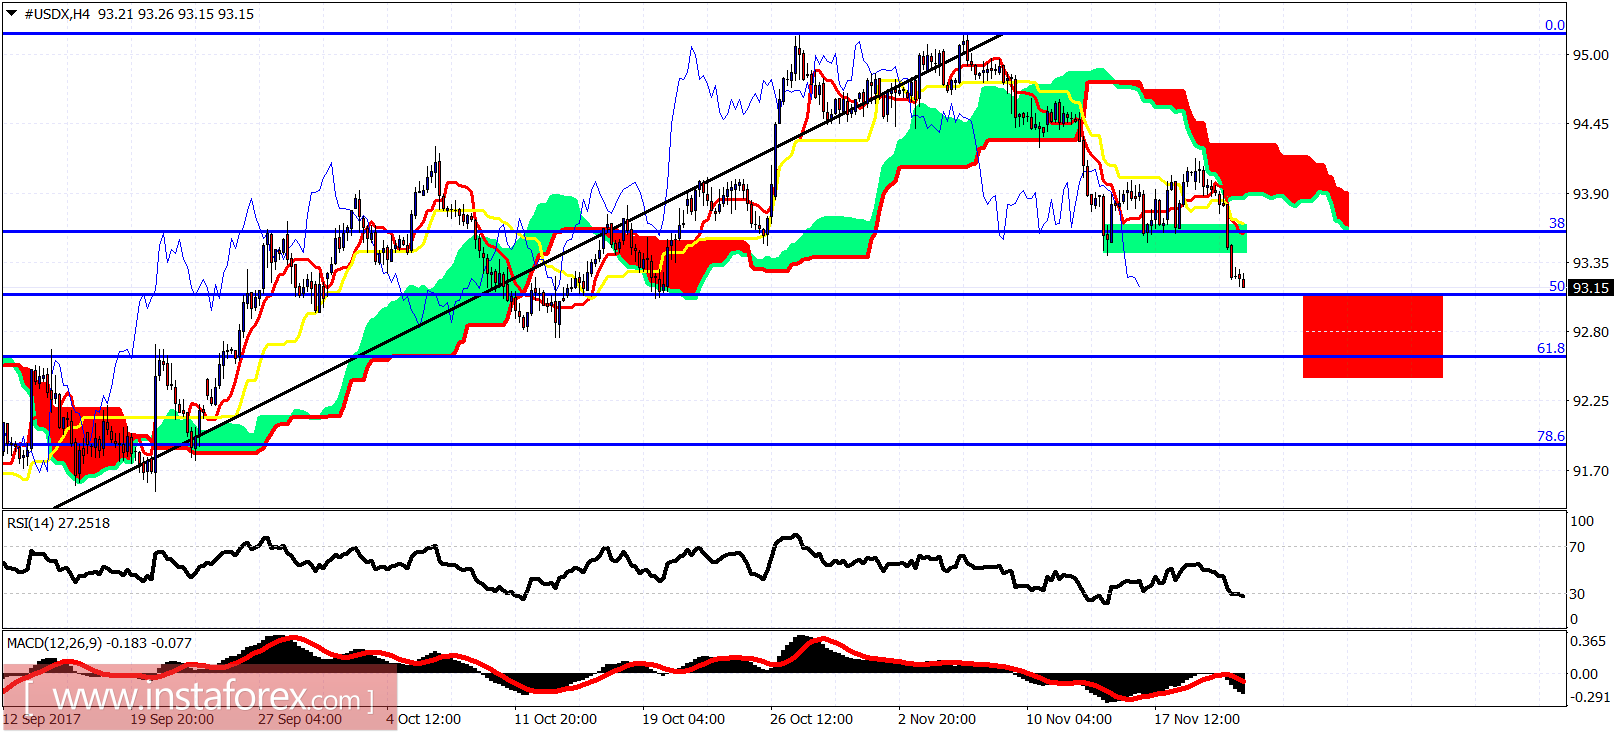
Red rectangle - target area
The Dollar index is now at the 50% Fibonacci retracement. We could see a bounce today but short-term trend is expected to remain bearish and price to move towards the red rectangular price range. Support is at 92.50 at the 61.8% Fibonacci retracement.
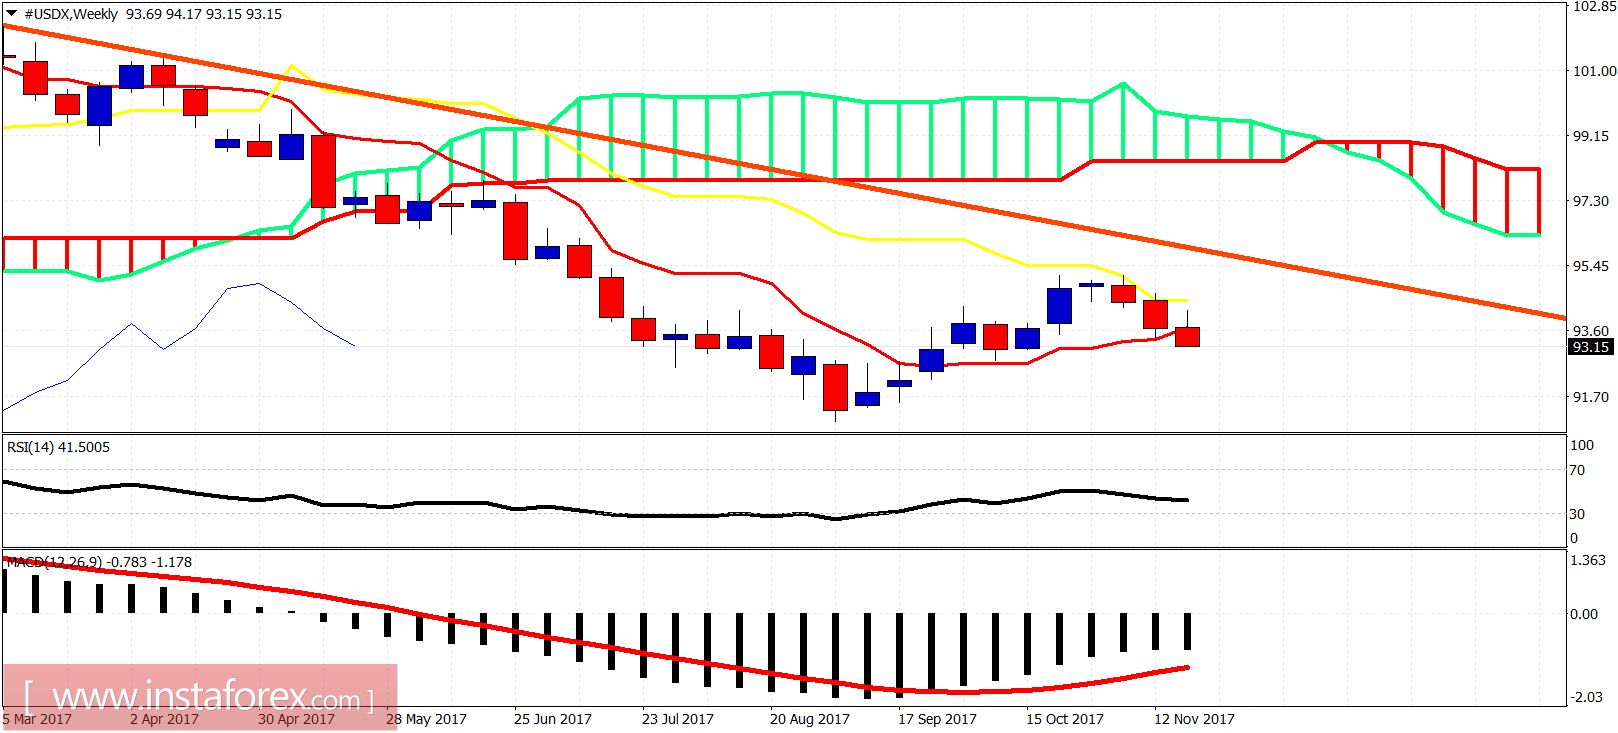
The Dollar index in the weekly chart is breaking below the tenkan-sen. This is a bearish sign. A weekly close below the tenkan-sen will imply more downside next week. Trend remains bearish. Although I believe that we should expect a strong reversal next week, there is still no reversal sign or confirmation of a reversal yet.


