Main Quotes Calendar Forum
flag

FX.co ★ Ichimoku indicator analysis of gold for November 24, 2017

parent
Forex Analysis:::2017-11-24T08:03:29

Ichimoku indicator analysis of gold for November 24, 2017

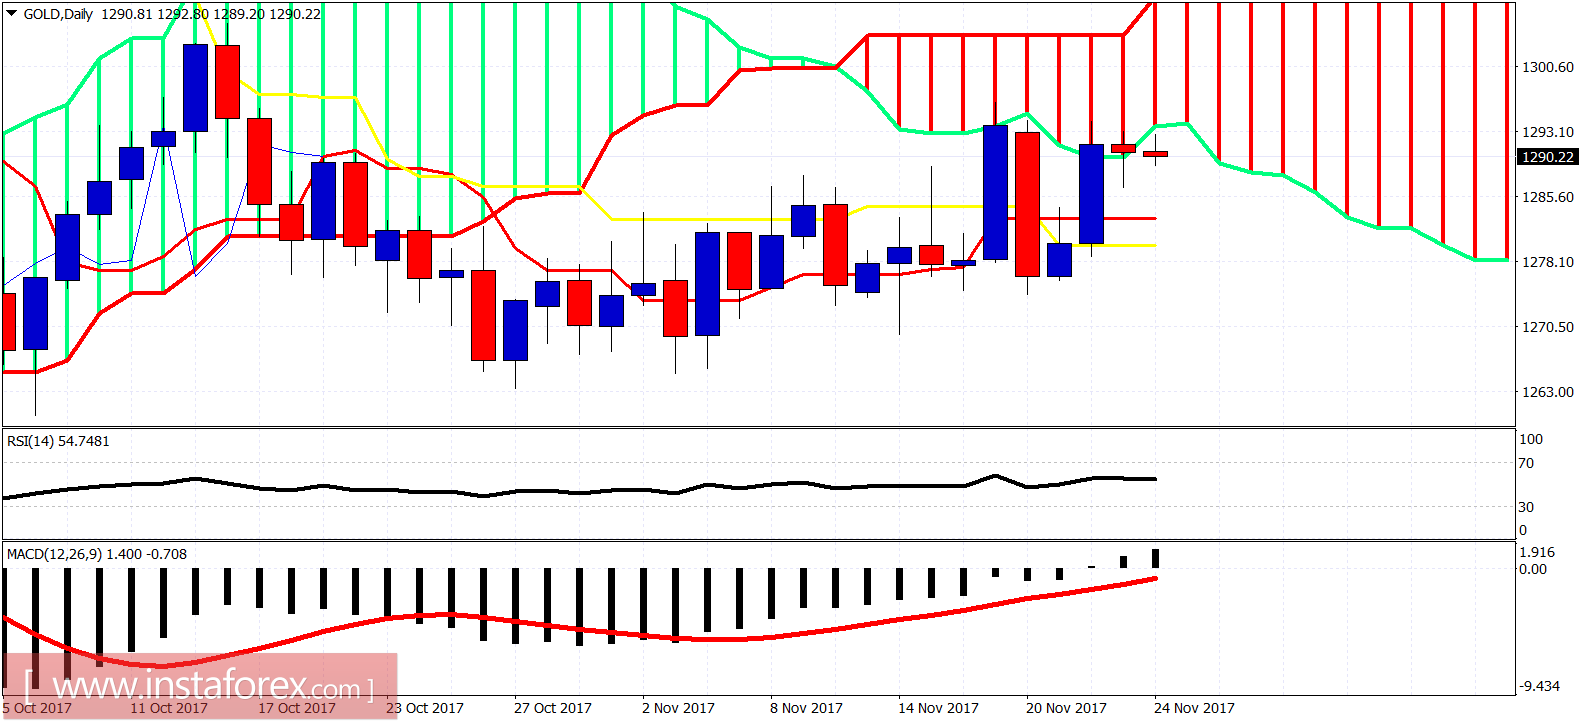
Gold price remains inside the sideways channel just below important resistance levels. I continue to expect Gold to move lower towards $1,250 before resuming the longer-term upward move.

Ichimoku indicator analysis of gold for November 24, 2017

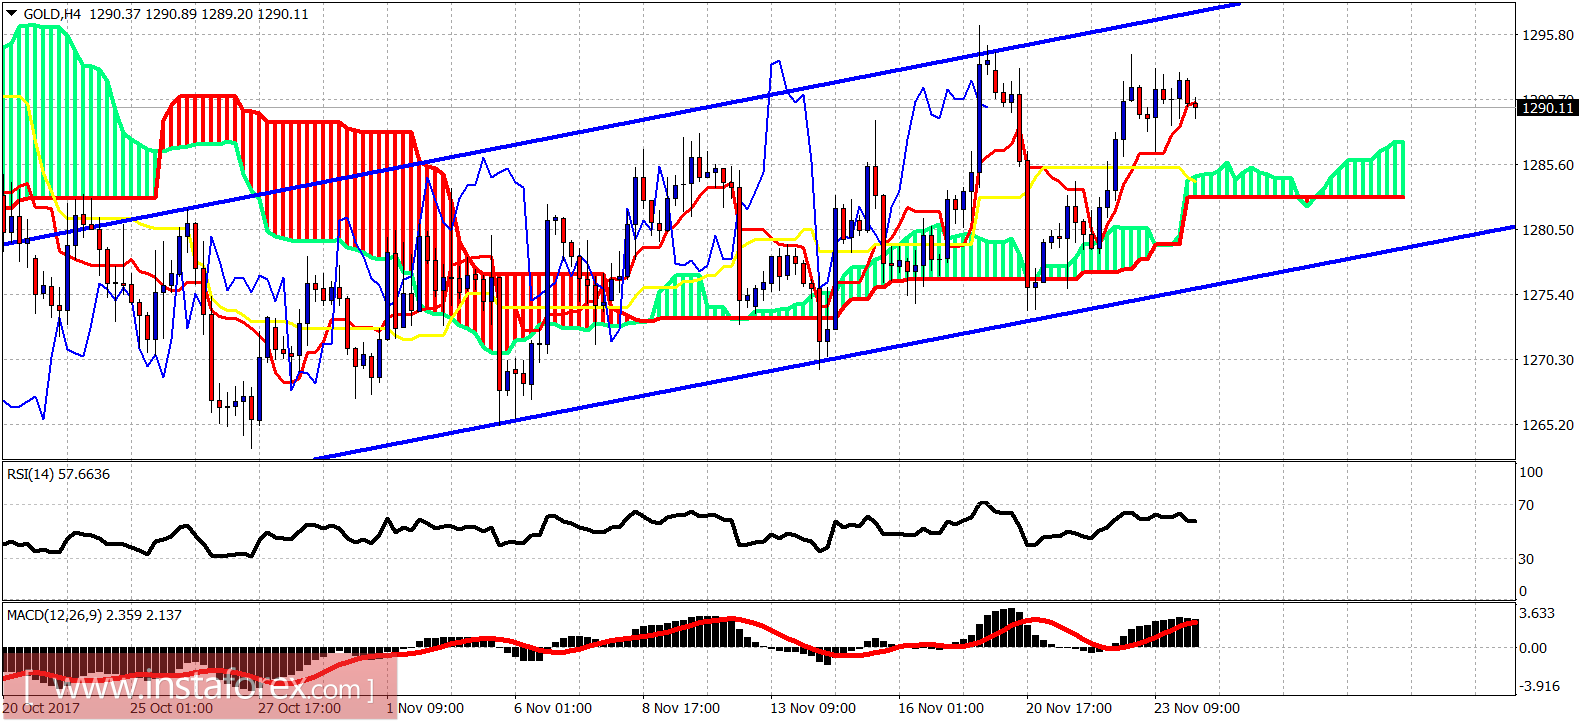
Blue lines - trading range

The Gold price is above the Ichimoku cloud in the 4 hour chart. This is a bullish sign. Support is at $1,285 and next at $1,277. Resistance is at $1,294 and next at $1,300. Gold is making an overlapping upward move since late October lows. This is not impulsive price action.

Ichimoku indicator analysis of gold for November 24, 2017

On a daily basis, the Gold price is testing the lower Kumo (cloud) boundary resistance. A rejection here will push price towards $1,280-78 daily support. A daily close below this support will open the way for a move towards $1,250. Breaking above $1,294 will open the way for a move towards $1,300.
Analyst InstaForex
Share this article:
parent
loader...
all-was_read__icon
You have watched all the best publications
presently.
We are already looking for something interesting for you...
all-was_read__star
Recently published:
loader...
More recent publications...