


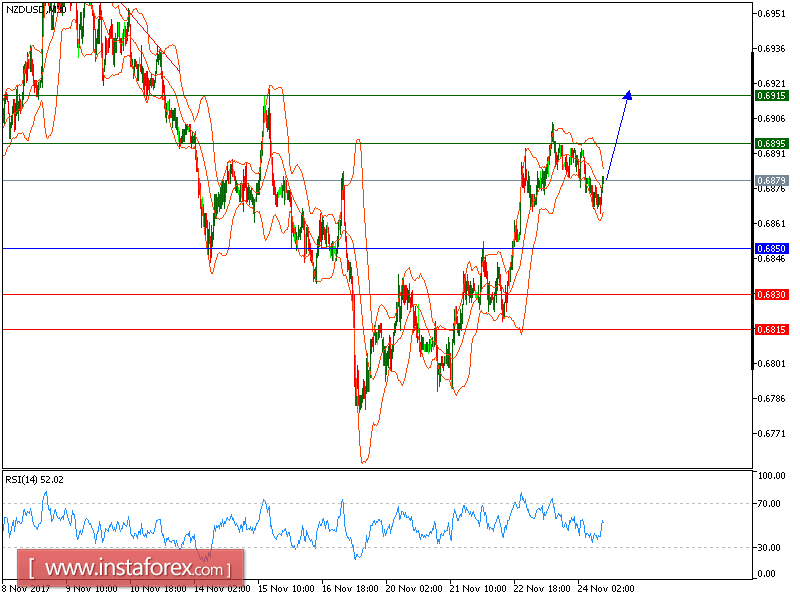
NZD/USD is expected to trade with a bullish bias above 0.6850. The pair remains bullish above its key support at 0.6850, which should limit any downside room. The relative strength index is mixed, but lacks downward momentum. Therefore, even though a consolidation cannot be ruled out at the current stage, its extent should be limited.
As long as 0.6850 is not broken, look for a new rebound to 0.6895 and 0.6915 in extension.
The black line shows the pivot point. Currently, the price is above the pivot point, which indicates long positions. If it remains below the pivot point, it will indicate short positions. The red lines are showing the support levels and the green line is indicating the resistance levels. These levels can be used to enter and exit trades.
Resistance levels: 0.6895, 0.6915, and 0.6950
Support levels: 0.6830, 0.6815, and 0.6790


