Main Quotes Calendar Forum
flag

FX.co ★ Ichimoku indicator analysis of gold for November 27, 2017

parent
Forex Analysis:::2017-11-27T08:08:51

Ichimoku indicator analysis of gold for November 27, 2017

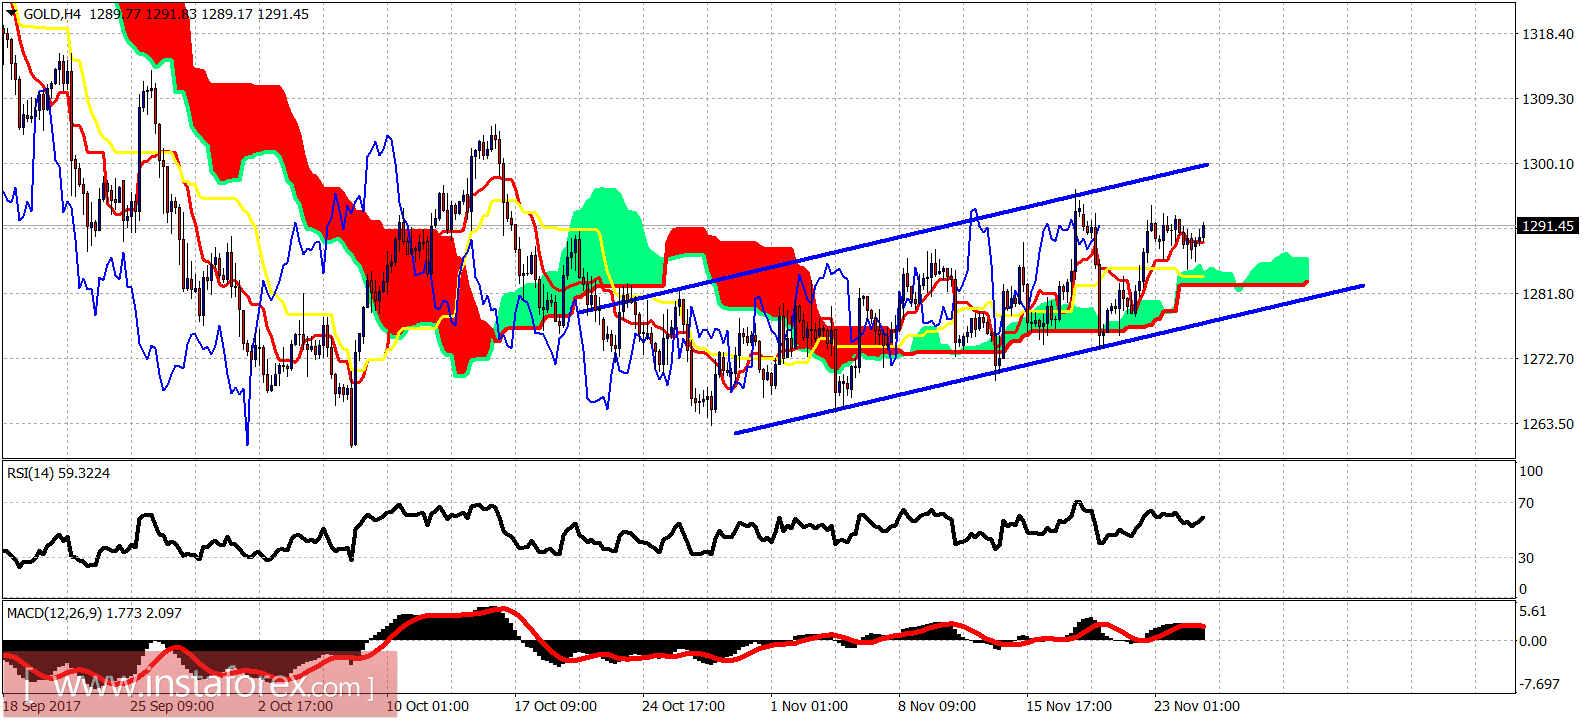
Gold price is in a short-term bullish trend as price is above the 4-hour Ichimoku cloud and is making higher highs and higher lows. Price is steadily moving higher but on very slow pace. The form of the price rise has an overlapping price structure which suggests that this upward move is not impulsive.

Ichimoku indicator analysis of gold for November 27, 2017

Blue lines - bullish channel

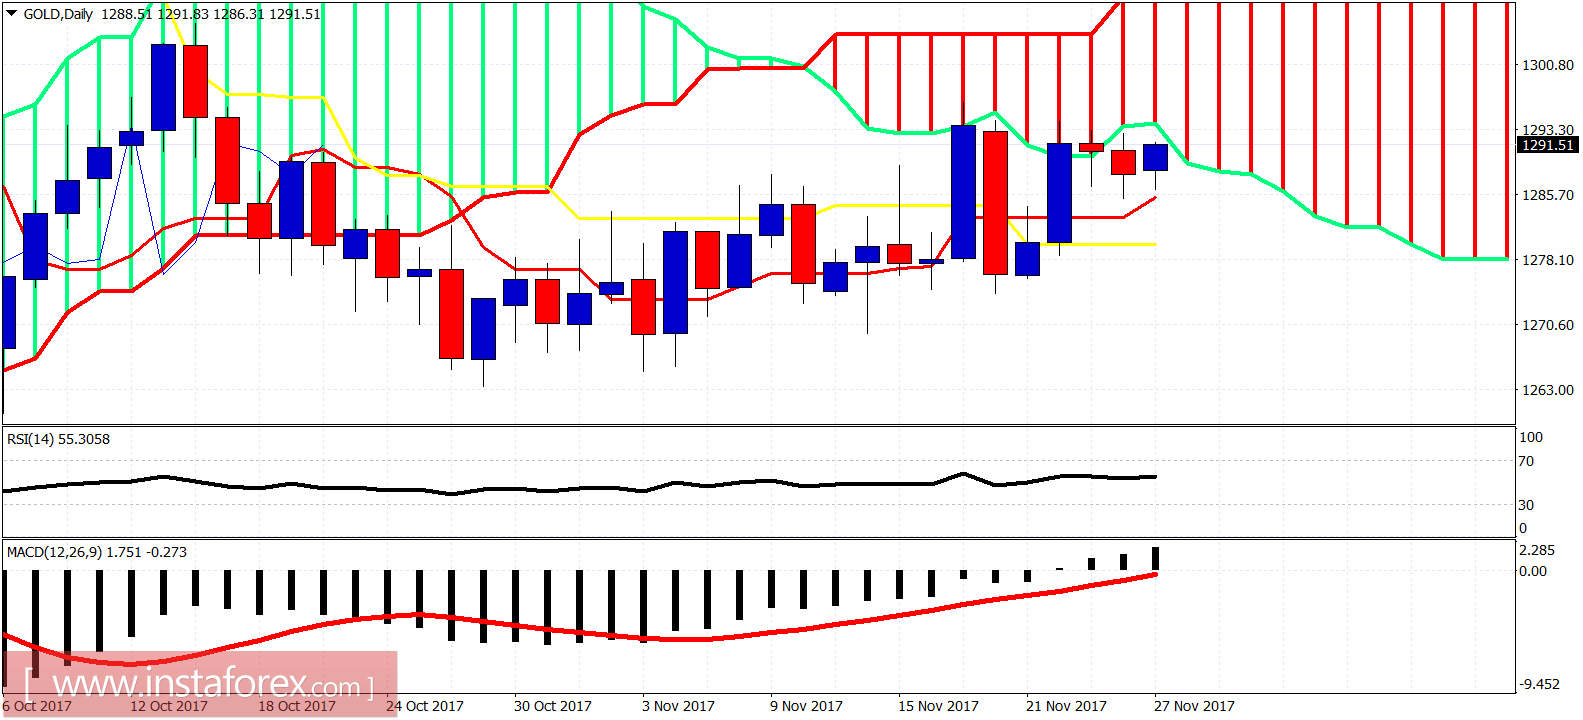
Gold price is trading at $1,291.50 above both the tenkan- and kijun-sen indicators. Price made an important low late October around $1,260 and ever since it is mainly moving sideways as price has not yet broken above the October high of $1,305. Support is at $1,281. Breaking below that level will push price towards $1,270-$1,260 and eventually towards our short-term target of $1,250-45. Resistance is at $1,299-$1,305.

Ichimoku indicator analysis of gold for November 27, 2017

On a daily basis Gold price is testing the lower boundary of the Ichimoku cloud. Support is on Friday's low and resistance at $1,294-95. A rejection here will increase the chances of my bearish short-term scenario for a move towards $1,250 before the resumption of the up trend.
Analyst InstaForex
Share this article:
parent
loader...
all-was_read__icon
You have watched all the best publications
presently.
We are already looking for something interesting for you...
all-was_read__star
Recently published:
loader...
More recent publications...