Main Quotes Calendar Forum
flag

FX.co ★ Ichimoku indicator analysis of USDX for November 27, 2017

parent
Forex Analysis:::2017-11-27T08:14:35

Ichimoku indicator analysis of USDX for November 27, 2017

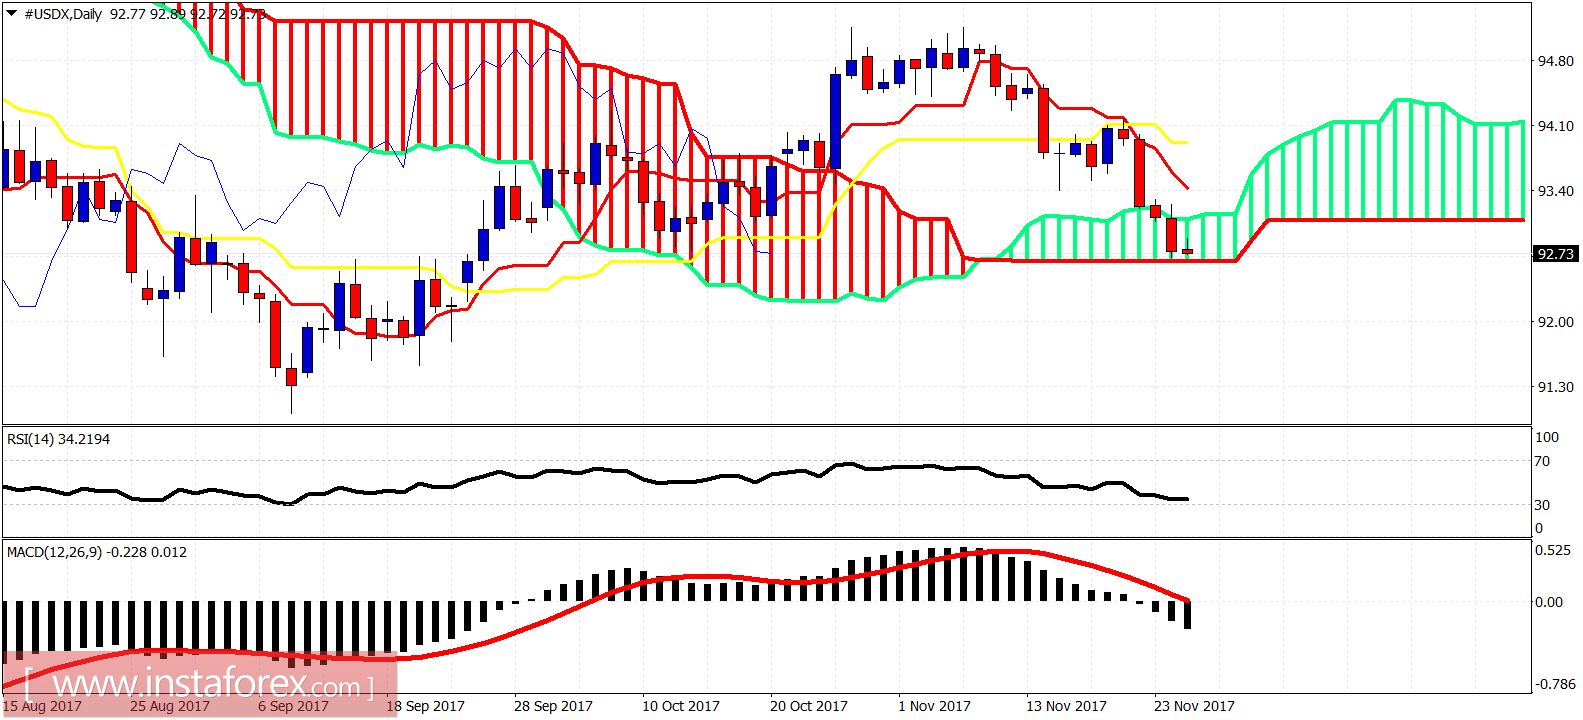
The Dollar index has reached our short-term target area and the 61.8% Fibonacci retracement at 92.50. I expect a reversal from current levels to the upside. However we have still not seen any reversal sign.

Ichimoku indicator analysis of USDX for November 27, 2017

Green rectangle - support area (broken)

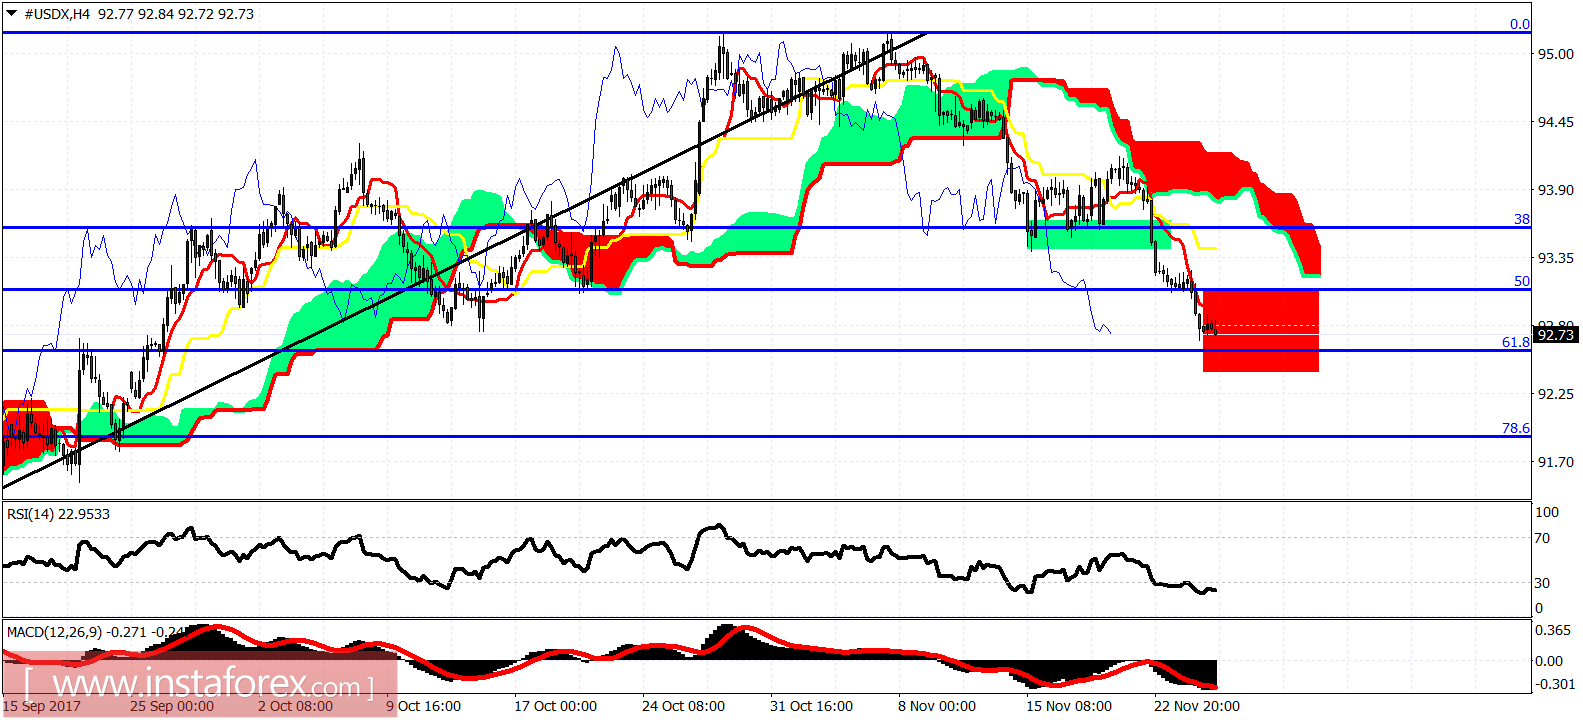
Red rectangle - target area (reached)

The Dollar index has finally reached our short-term target. Trend is bearish as price remains below the 4 hour Kumo (cloud). Support is at the 61.8% Fibonacci retracement at 92.50 while resistance is at 93.40 and next at 93.90.

Ichimoku indicator analysis of USDX for November 27, 2017

The Dollar index has entered the Ichimoku cloud area in the daily chart. A daily close below the cloud will be a bearish sign. Trend is neutral but very close to turning bearish again on a daily basis. I expect the Dollar index to bounce from the cloud support. Important Daily resistance at 94.10. Break above it and we could see more than just a bounce in the Dollar.
Analyst InstaForex
Share this article:
parent
loader...
all-was_read__icon
You have watched all the best publications
presently.
We are already looking for something interesting for you...
all-was_read__star
Recently published:
loader...
More recent publications...