


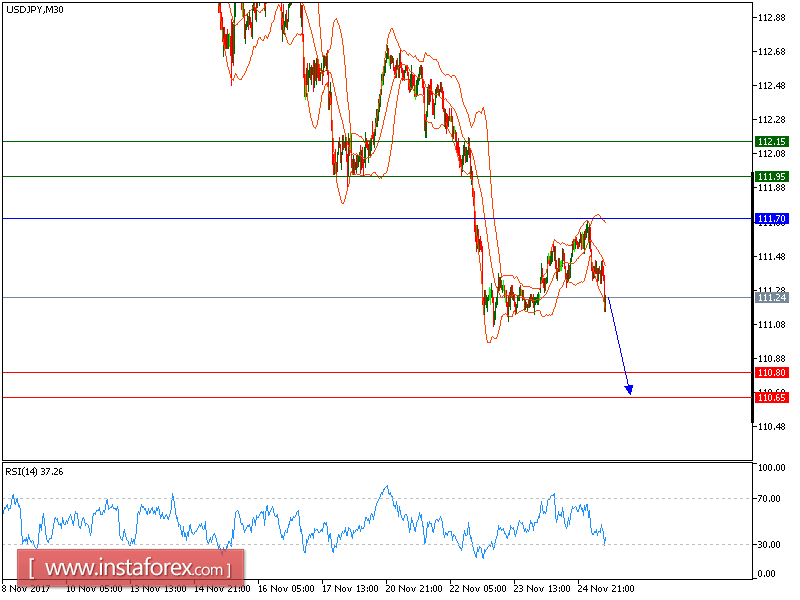
USD/JPY is expected to trade with a bearish outlook. The pair has continued to grind lower after marking a low of 111.04 last Thursday (November 23). Currently, as shown on a 30-minute chart, it is supported by the ascending 20-period moving average, which stays below the 50-period one. Meanwhile, the relative strength index sink below the neutrality level of 50, showing a lack of upward momentum for the pair.
As the intraday outlook has turned bearish, the pair is expected to work its way back to 110.80 on the downside. Key support is located at 111.70,
Alternatively, if the price moves in the opposite direction, a long position is recommended above 111.65 with a target at 111.95.
Chart Explanation: The black line shows the pivot point. The current price above the pivot point indicates a bullish position, while the price below the pivot point is a signal for a short position. The red lines show the support levels and the green line indicates the resistance level. These levels can be used to enter and exit trades.
Strategy: SELL, Stop Loss: 111.70, Take Profit: 110.80
Resistance levels: 111.95, 112.40 and 112.70 Support Levels: 110.80, 110.65, 110.30


