


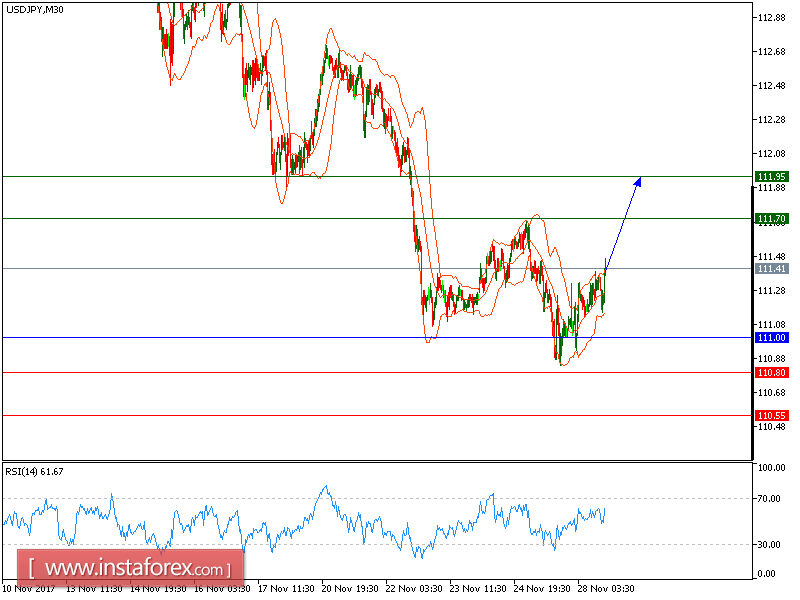
USD/JPY is expected to trade with a bullish outlook. The pair swiftly slid to the upside. Currently, it keeps trading on the upside while proceeding toward the immediate resistance at 111.70 . The 20-period moving average has just crossed above the 50-period one. And the relative strength index is trading above the neutrality area, indicating further upward momentum for the pair.
Above 111, expect a further upside toward 111.70.
Alternatively, if the price moves in the opposite direction, a short position is recommended below 111.00 with a target at 111.70.
Chart Explanation: The black line shows the pivot point. The current price above the pivot point indicates a bullish position, while the price below the pivot point is a signal for a short position. The red lines show the support levels and the green line indicates the resistance level. These levels can be used to enter and exit trades.
Strategy: BUY, Stop Loss: 111.00, Take Profit: 111.70
Resistance levels: 111.70, 111.95 and 112.30 Support Levels: 110.80, 110.55, 110.30


