Main Quotes Calendar Forum
flag

FX.co ★ Ichimoku indicator analysis of gold for November 29, 2017

parent
Forex Analysis:::2017-11-29T08:10:15

Ichimoku indicator analysis of gold for November 29, 2017

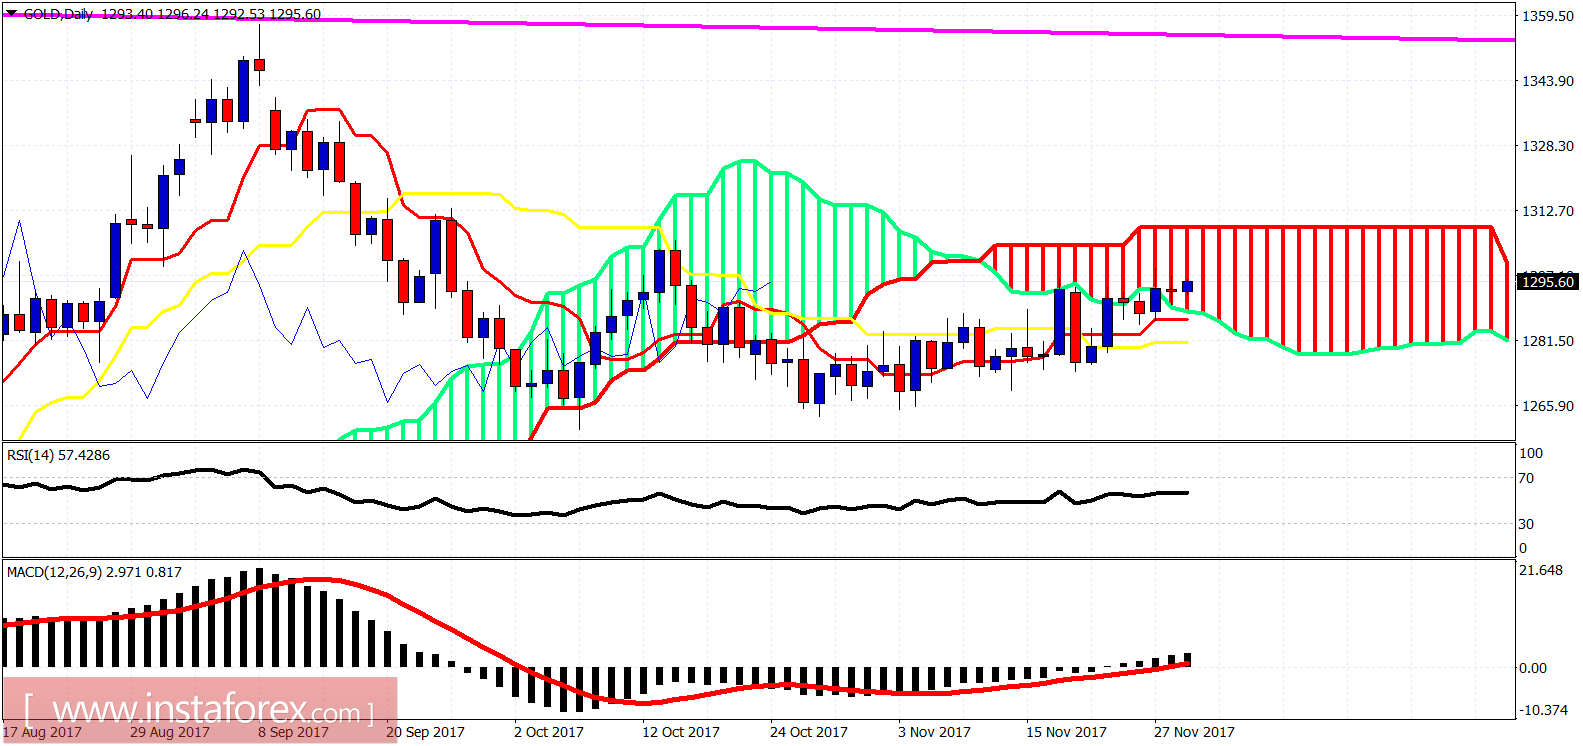
Gold price remains near the highs of the trading range it has been trapped in for the past few sessions. Trend remains bullish but with a weak momentum. Price is hovering above support levels and could continue higher towards $1,310. However I believe the downside for Gold is not over.

Ichimoku indicator analysis of gold for November 29, 2017

Blue lines - bullish channel

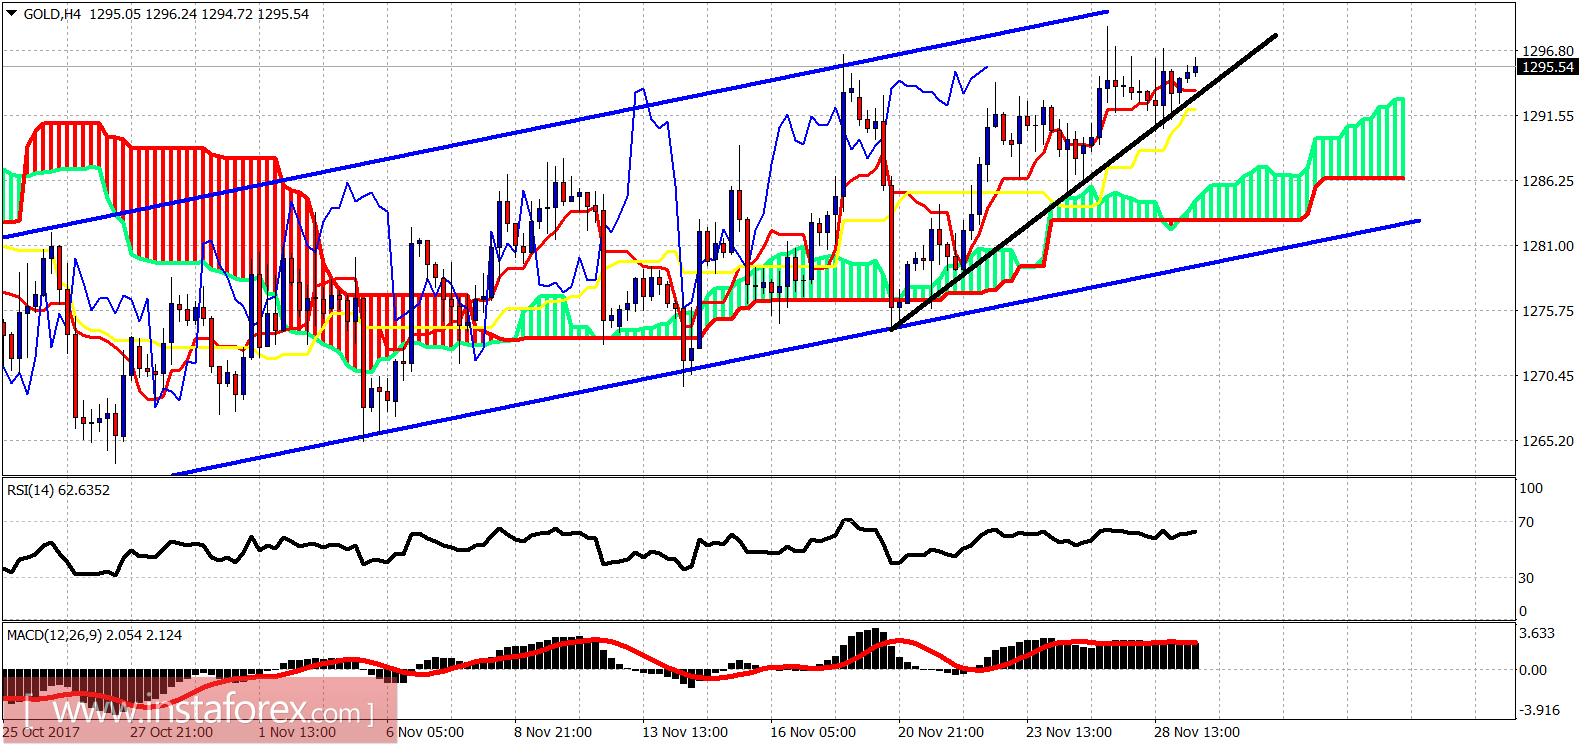
Black line - trend line support

Gold price is in a bullish short-term trend. Support is at $1,290 and most important support is at $1,281. Resistance is at $1,300 and next at $1,310. I do not believe the upside in Gold has much more potential.

Ichimoku indicator analysis of gold for November 29, 2017

On a daily basis, Gold price has entered the Ichimoku cloud. Price could now move towards the upper cloud boundary at $1,310. However, this cloud could also be seen as resistance. So any rejection and a break below $1,280 on a daily close will strengthen my bearish short-term view for $1,250. I remain longer-term bullish but I believe bulls will get a better chance to buy lower.
Analyst InstaForex
Share this article:
parent
loader...
all-was_read__icon
You have watched all the best publications
presently.
We are already looking for something interesting for you...
all-was_read__star
Recently published:
loader...
More recent publications...