


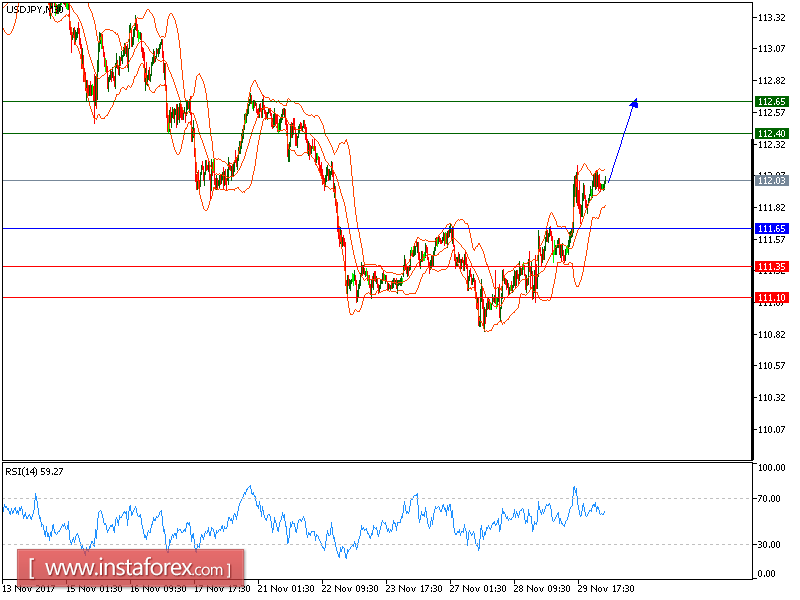
All our upside targets which we predicted in yesterday's analysis have been hit. USD/JPY is expected to trade with a bullish outlook. the pair is breaching the 112.00 level on the upside while being supported by the ascending 20-period moving average. The relative strength index stays above the neutrality level of 50 showing a lack of downward momentum for the pair. The intraday outlook continues to be bullish, and the pair is expected to advance toward 112.40 before targeting 112.65. Only a break below the key support at 111.65 would bring about a bearish reversal.
Alternatively, if the price moves in the opposite direction, a short position is recommended below 111.65 with a target of 111.35.
Chart Explanation: The black line shows the pivot point. The current price above the pivot point indicates a bullish position, while the price below the pivot point is a signal for a short position. The red lines show the support levels and the green line indicates the resistance level. These levels can be used to enter and exit trades.
Strategy: BUY, Stop Loss: 111.65, Take Profit: 112.40
Resistance levels: 112.40, 112.65 and 113.00 Support Levels: 111.35, 111.10, 110.70


