Main Quotes Calendar Forum
flag

FX.co ★ Ichimoku indicator analysis of gold for November 30, 2017

parent
Forex Analysis:::2017-11-30T08:06:33

Ichimoku indicator analysis of gold for November 30, 2017

As expected, gold price got rejected at the upper channel boundary. The break below the black trend line support has given a new short-term sell signal that so far remains in profit as price has fallen towards the lower channel boundary and cloud support.

Ichimoku indicator analysis of gold for November 30, 2017

Blue lines - bullish channel

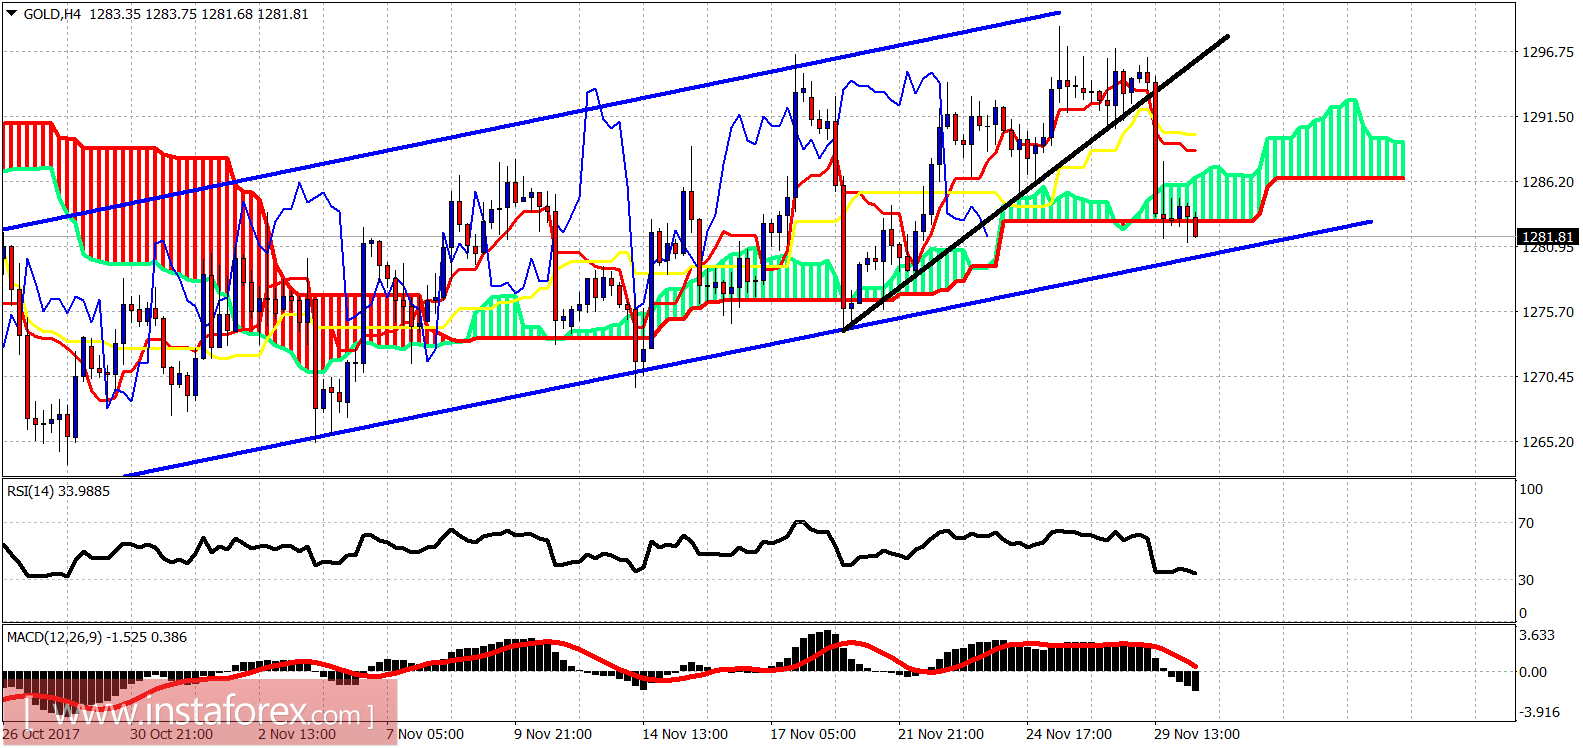
Black line - support (broken)

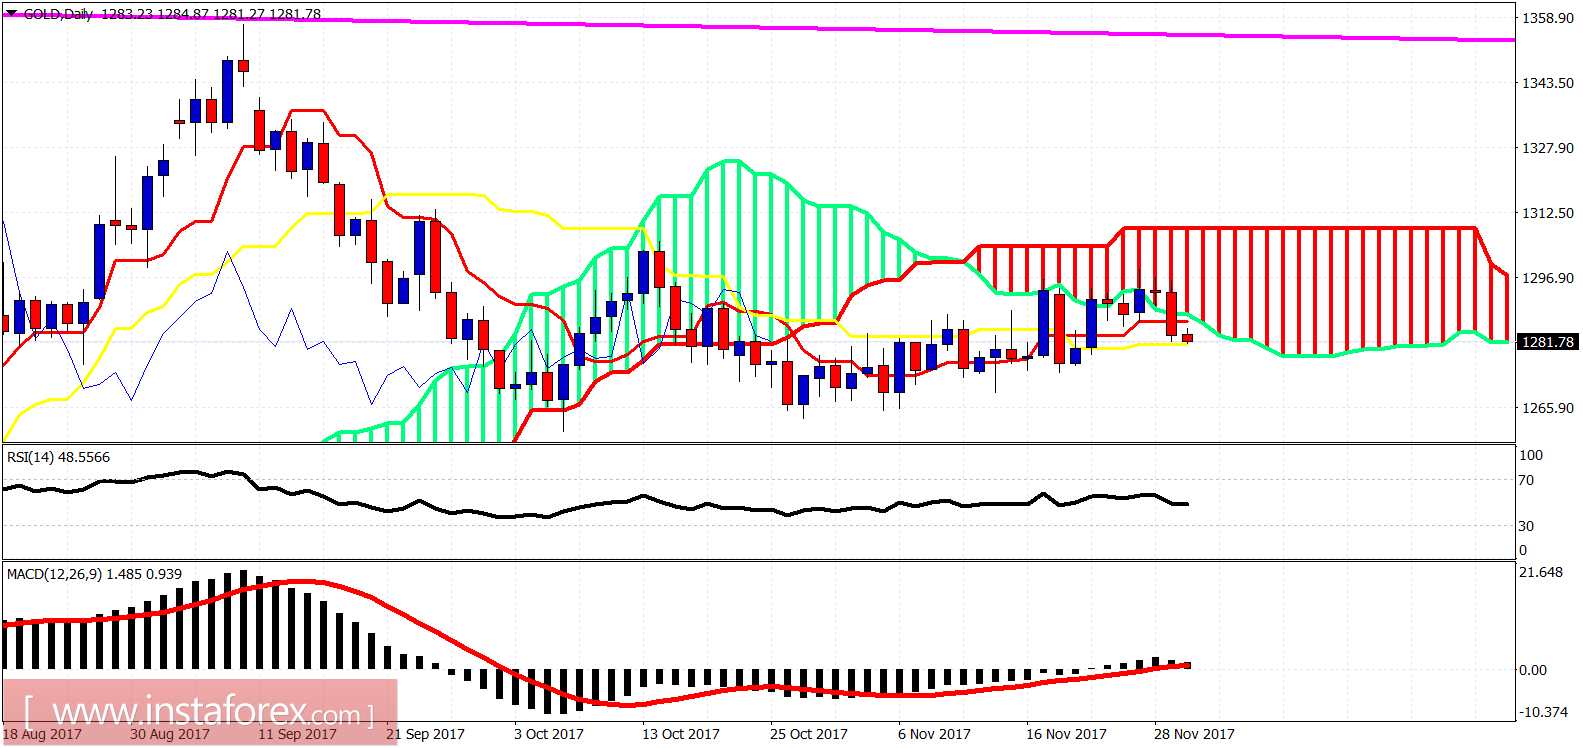
Gold price is breaking below the 4-hour Kumo support. Price is now testing the lower channel boundary. As I have been saying for the past few days, Gold price is expected to move sharply lower towards $1,250. A break below support of $1,280 will confirm that this move has started.

Ichimoku indicator analysis of gold for November 30, 2017

On a daily basis, Gold price has been rejected by the Daily Kumo (cloud). This is a bearish sign that we were expecting. Price is below the daily tenkan-sen (red line indicator) and is testing the kijun-sen (yellow line indicator). A daily close below the Kijun-sen will be a bearish sign. I expect Gold to move lower towards $1,250 over the coming days.
Analyst InstaForex
Share this article:
parent
loader...
all-was_read__icon
You have watched all the best publications
presently.
We are already looking for something interesting for you...
all-was_read__star
Recently published:
loader...
More recent publications...