


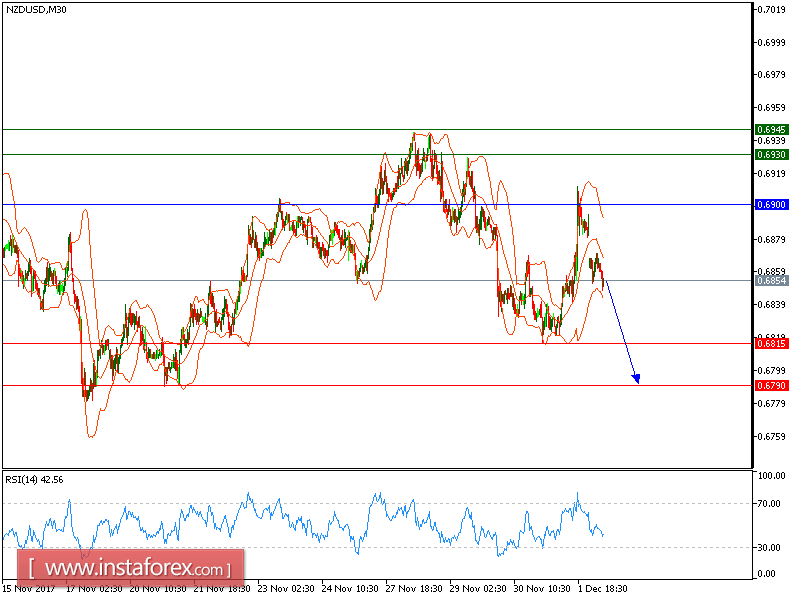
NZD/USD is under pressure. The pair posted a bearish gap this morning and also broke below its 20-period moving average. The key resistance at 0.6900 maintains the selling pressure on the prices. Besides, the relative strength index has just broken below its neutrality area at 50.
In conclusion, as long as 0.6900 holds on the upside, look for a new pullback to 0.6815 and 0.6790 in extension.
The black line shows the pivot point. Currently, the price is above the pivot point, which indicates long positions. If it remains below the pivot point, it will indicate short positions. The red lines are showing the support levels and the green line is indicating the resistance levels. These levels can be used to enter and exit trades.
Resistance levels: 0.6930, 0.6945, and 0.6985
Support levels: 0.6815, 0.6790, and 0.6730


