Main Quotes Calendar Forum
flag

FX.co ★ Ichimoku indicator analysis of gold for December 4, 2017

parent
Forex Analysis:::2017-12-04T08:23:06

Ichimoku indicator analysis of gold for December 4, 2017

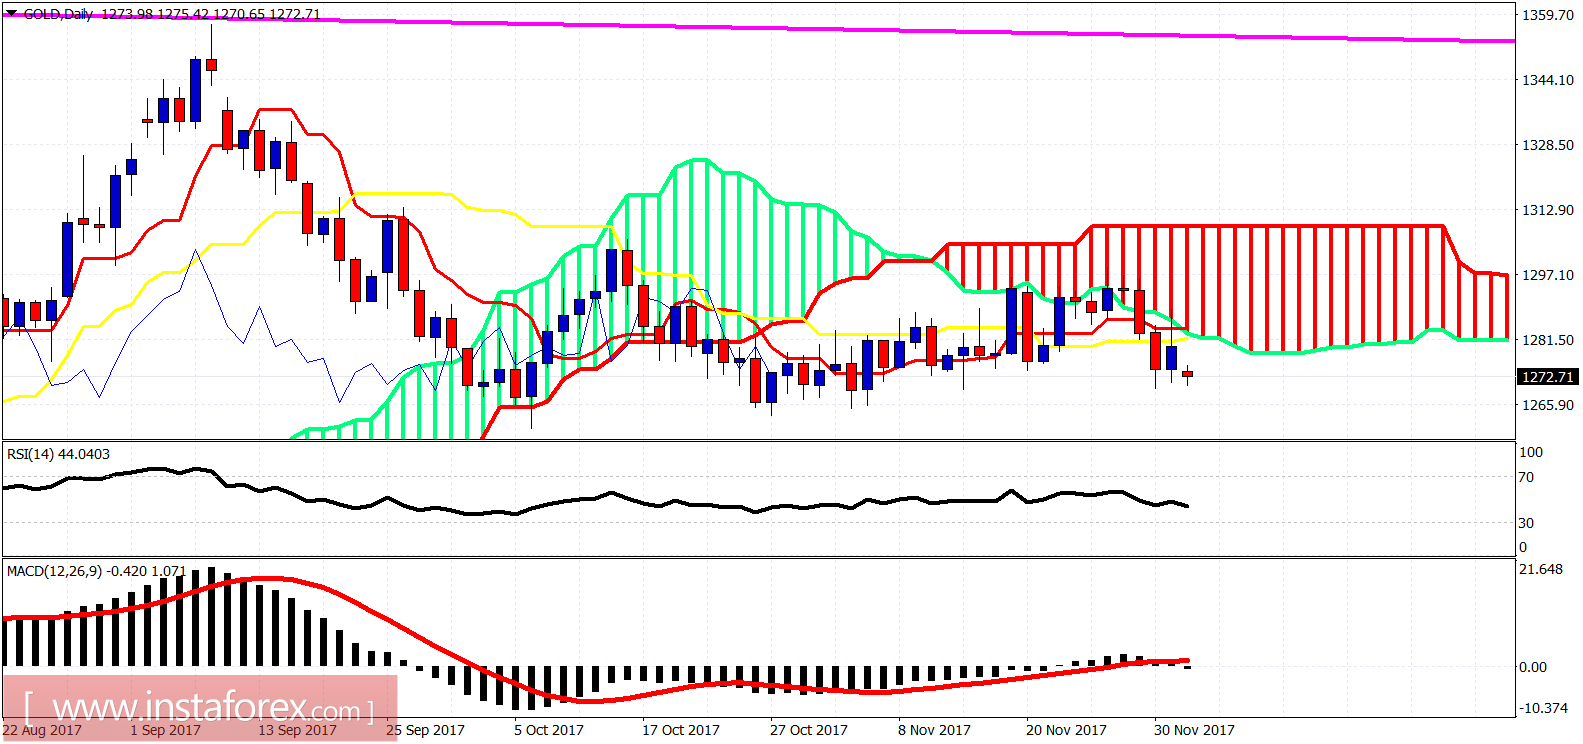
The Gold price has broken downwards. The price, as expected, got rejected below the $1,300 resistance area last week and is looking very bearish and ready to fall further towards our short-term $1,250 target. The Gold price bounced on Friday towards $1,285 as expected and is now re-testing recent lows.

Ichimoku indicator analysis of gold for December 4, 2017

Blue lines - bullish channel (broken)

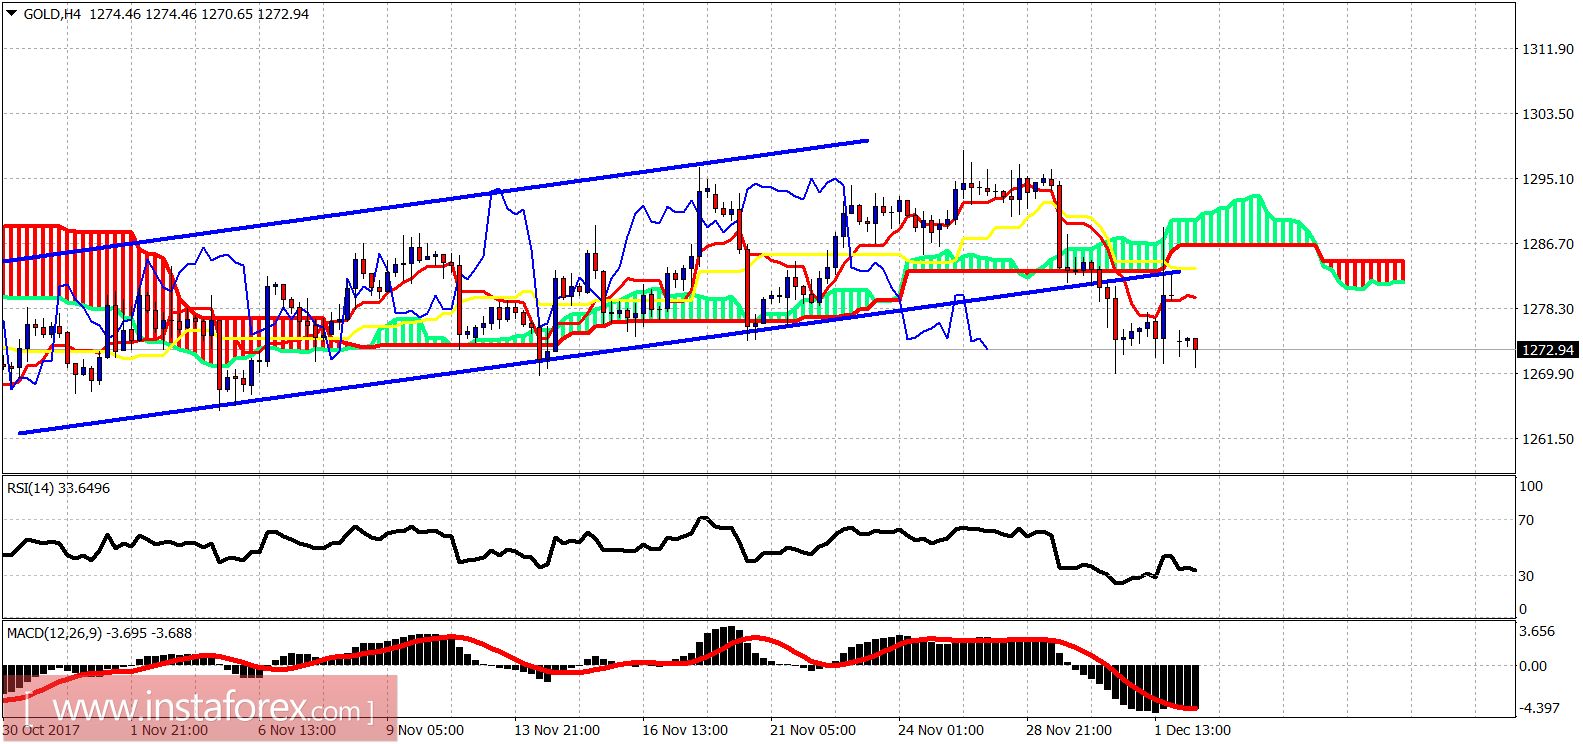
The Gold price has also broken below the 4-hour channel as expected. Price bounced on Friday towards cloud resistance and got rejected. The trend is bearish. Support is at $1,270 and next at $1,260. I expect both to be broken this week. Resistance is at $1,287-97 area. Only a break above this area will cancel my short-term view for a push lower towards $1,250.

Ichimoku indicator analysis of gold for December 4, 2017

On a daily basis, we warned last week that a rejection at the Kumo (cloud) would be a bearish sign. The price also gave another bearish sign by closing last week below the kijun-sen. The price tried to bounce on Friday but got rejected at the kijun-sen and closed below it. Trend is bearish. Expect Gold to move lower. Only a move above $1,287 will make me reconsider my primary bearish scenario.
Analyst InstaForex
Share this article:
parent
loader...
all-was_read__icon
You have watched all the best publications
presently.
We are already looking for something interesting for you...
all-was_read__star
Recently published:
loader...
More recent publications...