


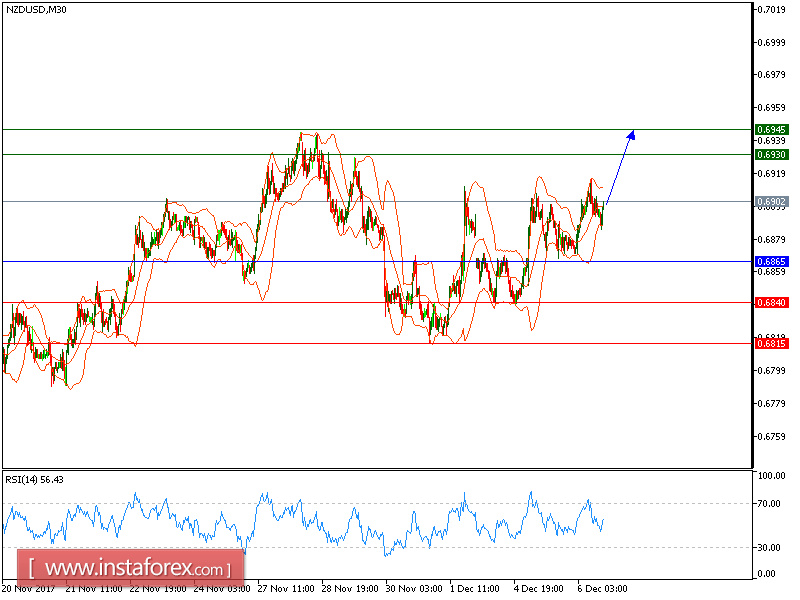
We will retain our yesterday's targets. The pair has clearly reversed upward and is now supported by its rising 20-period moving average.
The relative strength index is heading upward, and is showing strong bullish momentum. Besides, a support base at 0.6865 has formed, and should limit any downside room.
To sum up, as long as 0.6865 is not broken, look for a further advance to 0.6930 and 0.6945 in extension.
The black line shows the pivot point. Currently, the price is above the pivot point, which indicates long positions. If it remains below the pivot point, it will indicate short positions. The red lines are showing the support levels and the green line is indicating the resistance levels. These levels can be used to enter and exit trades.
Resistance levels: 0.6930, 0.6945, and 0.6985
Support levels: 0.6840, 0.6815, and 0.6770


