


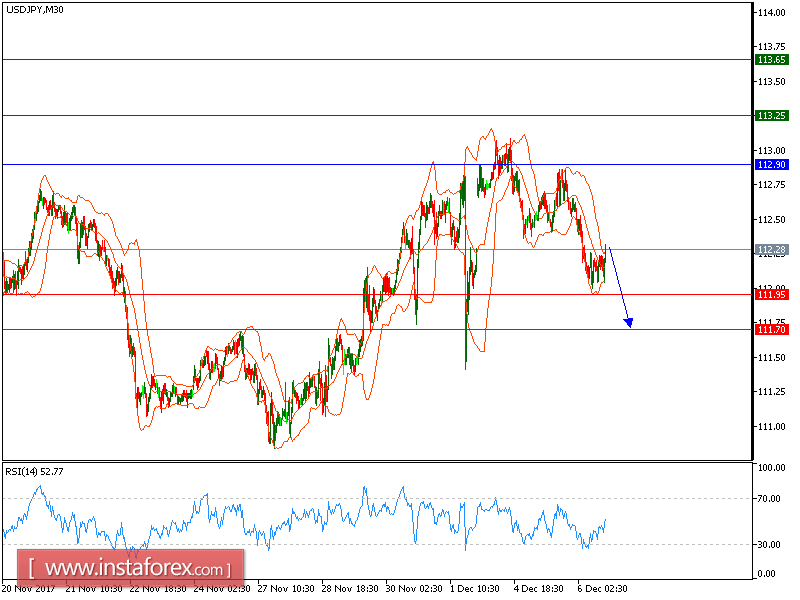
Our first target which we predicted in yesterday's analysis has been hit. The pair remains under pressure while being capped by the descending 20-period moving average. The relative strength index is still badly directed below the neutrality level of 50, showing a lack of upward momentum needed for a rebound. Intraday bearishness persists, The immediate trend remains down and the momentum is strong.
Hence, below 112.90, look for a further decline to 111.95 and 111.70 in extension.
Alternatively, if the price moves in the opposite direction, a long position is recommended above 112.90 with a target of 113.25.
Chart Explanation: The black line shows the pivot point. The current price above the pivot point indicates a bullish position, while the price below the pivot point is a signal for a short position. The red lines show the support levels and the green line indicates the resistance level. These levels can be used to enter and exit trades.
Strategy: SELL, Stop Loss: 112.90, Take Profit: 111.95
Resistance levels: 113.25, 113.65 and 114.00 Support Levels: 111.95, 111.70, 111.35


