Main Quotes Calendar Forum
flag

FX.co ★ Ichimoku indicator analysis of USDX for December 7, 2017

parent
Forex Analysis:::2017-12-07T07:53:35

Ichimoku indicator analysis of USDX for December 7, 2017

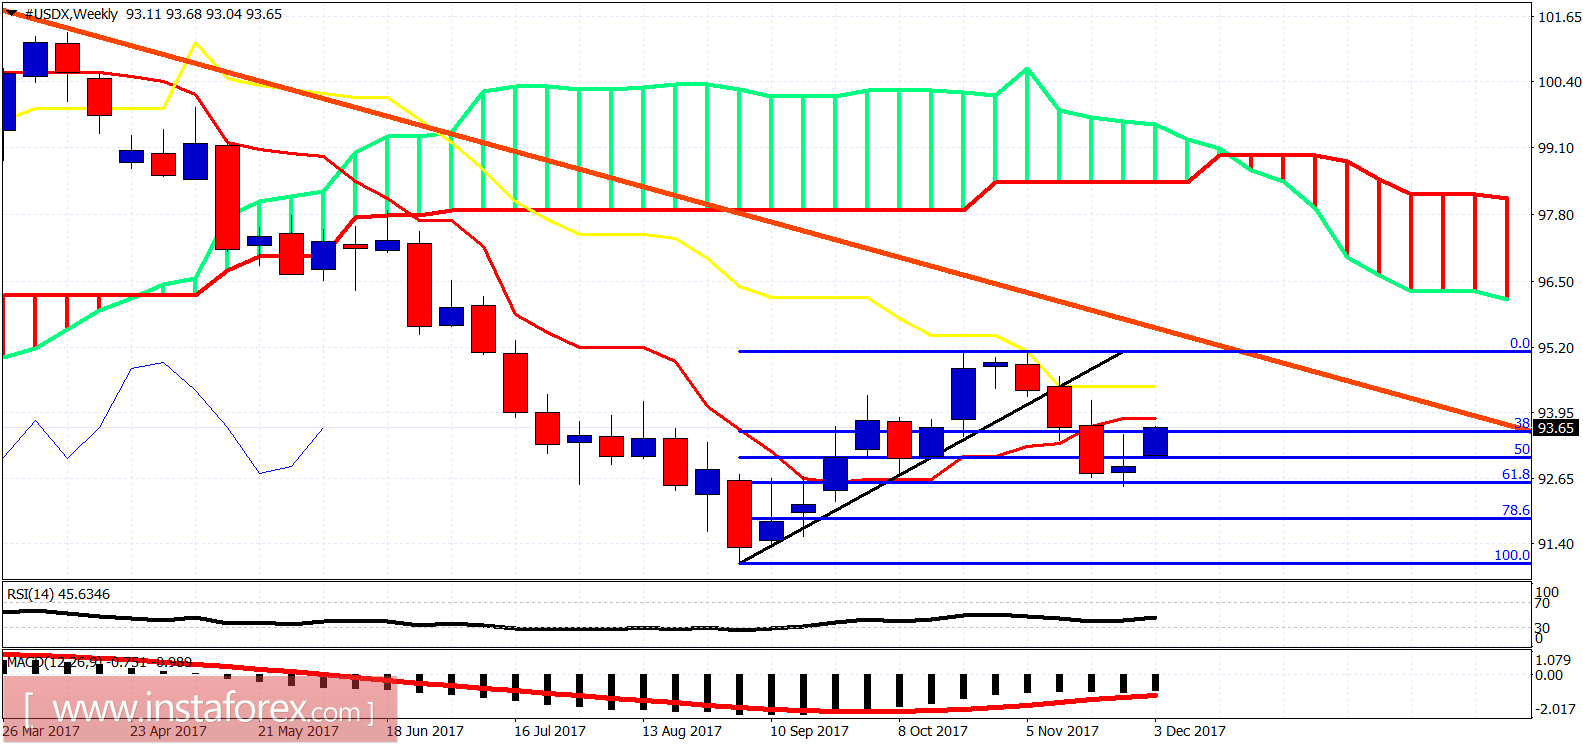
The US dollar index has broken out of the bearish Kumo cloud resistance. Trend is changing to bullish as long as price is above 93-92.50. The index has started making higher highs and higher lows on the 4 hour chart.

Ichimoku indicator analysis of USDX for December 7, 2017

Black lines - bullish channel

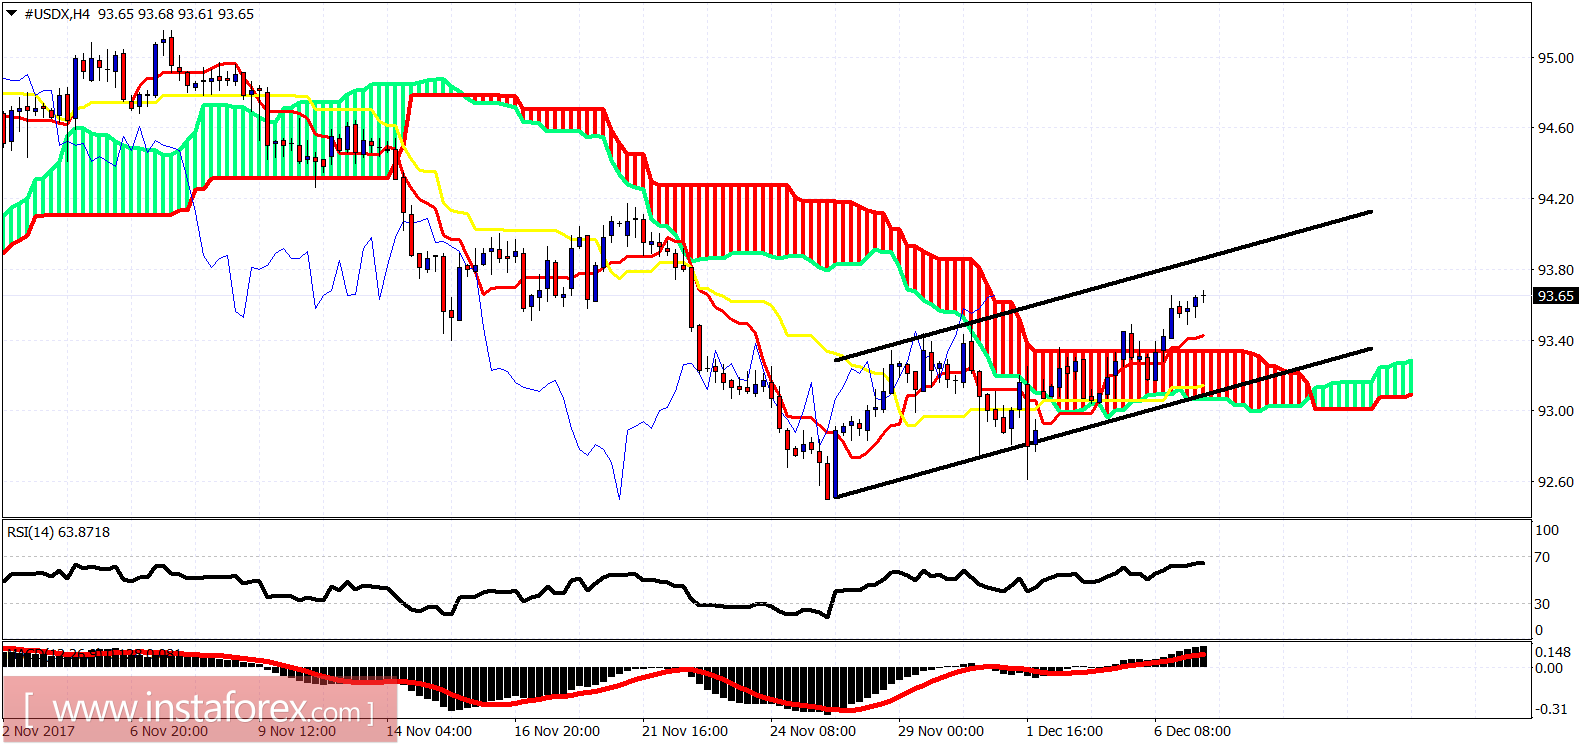
The Dollar index is trading above the Ichimoku cloud. Price is inside the bullish short-term channel. Support is found at 93.30 while the resistance lies at 93.80. Trend is bullish.

Ichimoku indicator analysis of USDX for December 7, 2017

On a weekly basis, the US dollar index has started the bounce exactly as expected. Price is now approaching the Tenkan-sen resistance at 93.80-93.90. A weekly close above this level will be a bullish sign. Next important resistance is at 94.40. Weekly support that must hold now is at 93. A break below 93 will be a very bearish sign for the index.
Analyst InstaForex
Share this article:
parent
loader...
all-was_read__icon
You have watched all the best publications
presently.
We are already looking for something interesting for you...
all-was_read__star
Recently published:
loader...
More recent publications...