


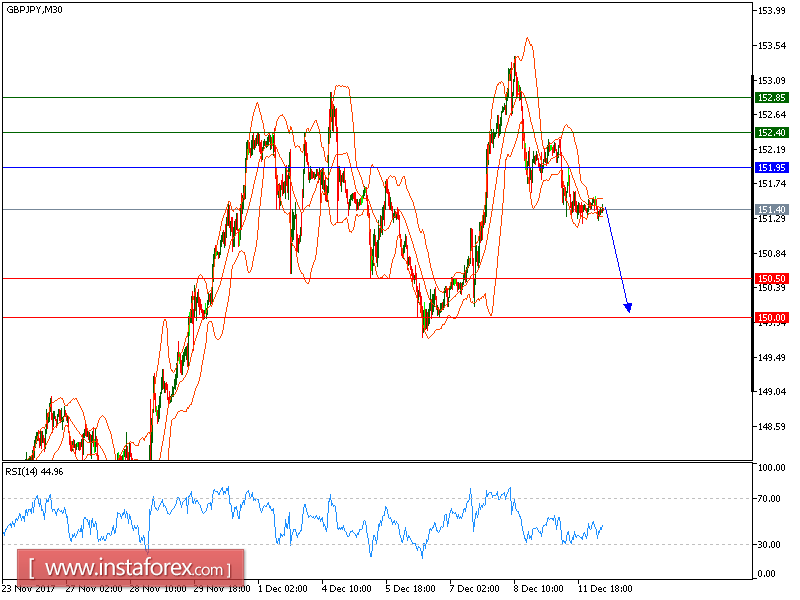
GBP/JPY is under pressure. The pair is trading below its declining 20-period and 50-period moving averages, which play resistance roles and maintain the downside bias. The relative strength index is below its neutrality level at 50 and lacks upward momentum.
To sum up, as long as 151.95 holds on the upside, look for a return to 150.50. A break below of this level would trigger a new decline to 150.00.
Alternatively, if the price moves in the direction opposite to the forecast, a long position is recommended above 151.95 with the target at 152.40
Strategy: SELL, Stop Loss: 151.95, Take Profit: 150.50
Chart Explanation: the black line shows the pivot point. The price above the pivot point indicates long positions; and when it is below the pivot points, it indicates short positions. The red lines show the support levels and the green line indicates the resistance levels. These levels can be used to enter and exit trades.
Resistance levels: 152.40, 152.85, and 153.15
Support levels: 150.50, 150.00, and 149.45


