


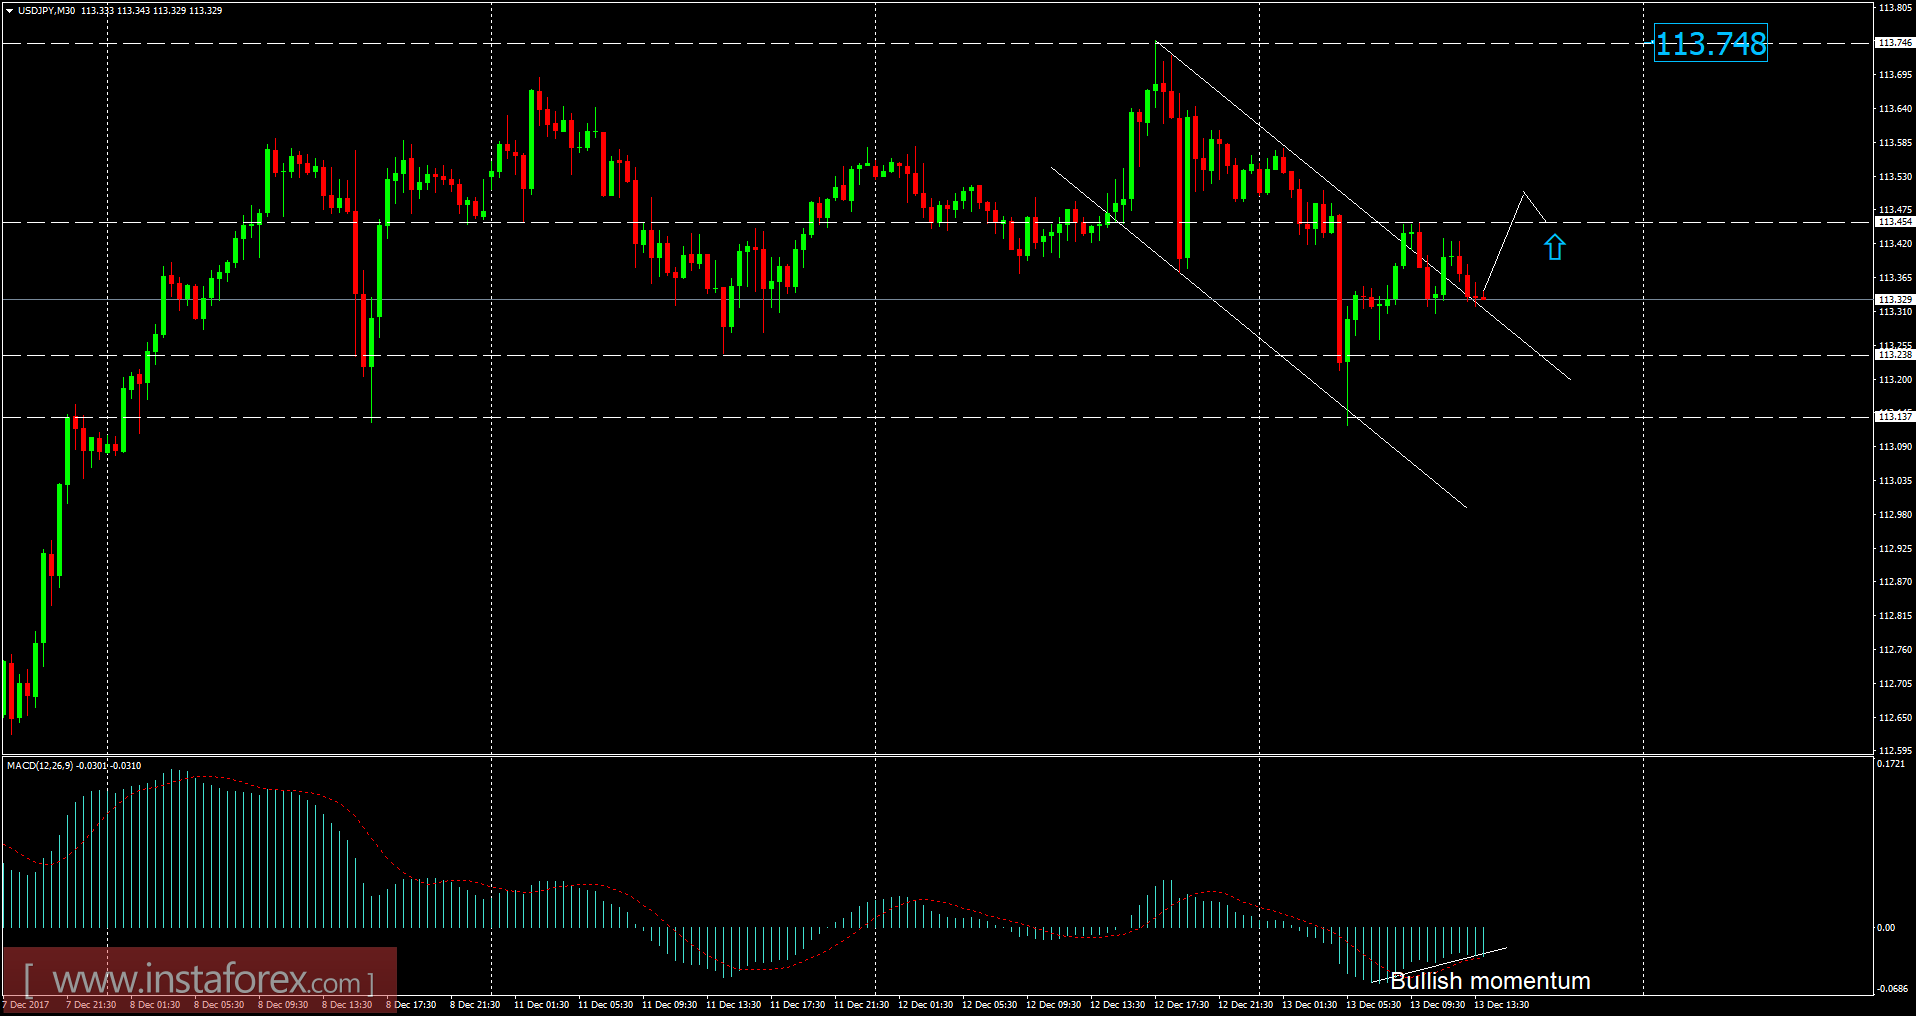
Recently, the USD/JPY has been trading sideways at the price of 113.35. According to the 30M time – frame, I found the broken bullish flag, which is a sign that selling looks risky. I also found a bullish momentum on the MACD oscillator, this is another sign of potential strength. My advice is to watch for buying opportunities if the price breaks the level of 113.45. The upward target is set at the price of 113.75.
Resistance levels:
R1: 113.35
R2: 113.17
R3: 112.98
Support levels:
S1: 113.74
S2: 113.93
S3: 114.12
Trading recommendations for today: watch for potential buying opportunities.


