


The pair is currently doing a consolidation above the 200 SMA at H1 chart and remains capped by the resistance zone of 1.3444. Such level should give up in order to allow further gains towards the 1.3516 level, at which lies a key resistance and offer zone. To the downside, the nearest support lies at the moving average mentioned above.
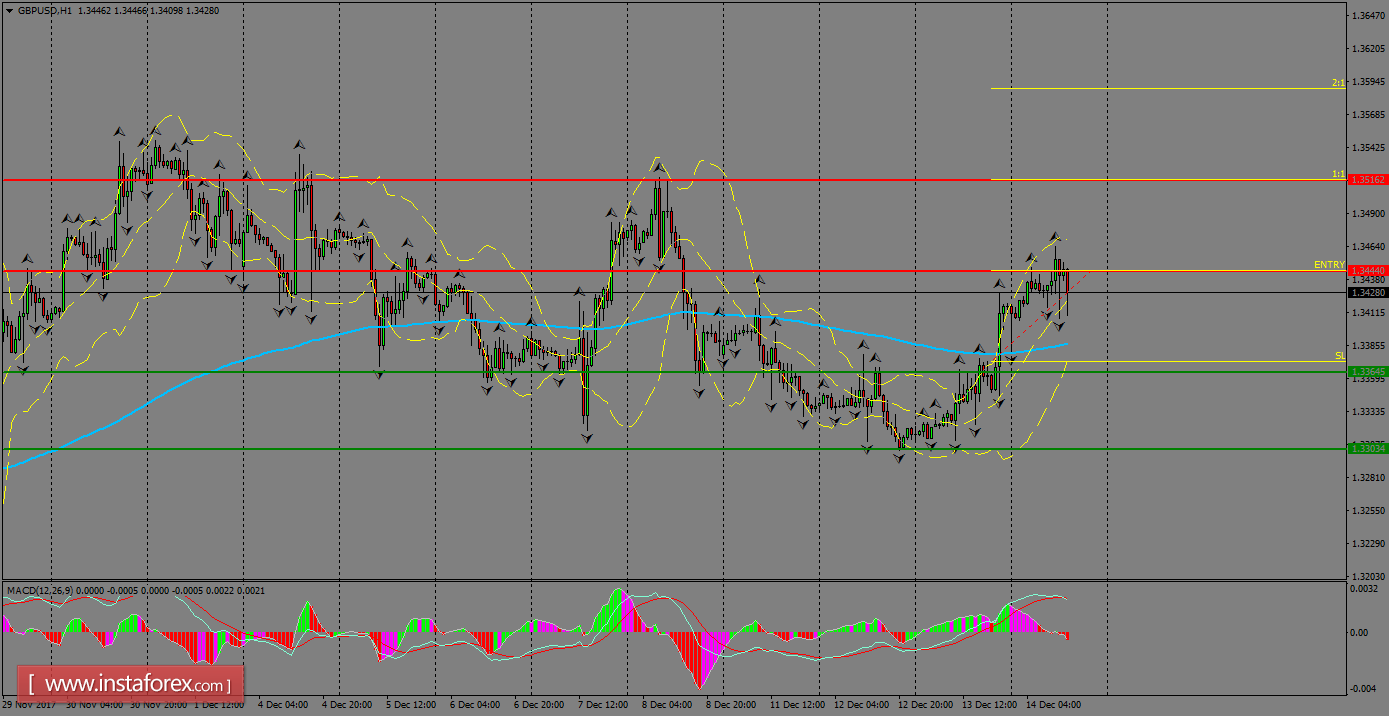
H1 chart's resistance levels: 1.3444 / 1.3516
H1 chart's support levels: 1.3364 / 1.3303
Trading recommendations for today: Based on the H1 chart, buy (long) orders only if the GBP/USD pair breaks a bullish candlestick; the resistance level is at 1.3444, take profit is at 1.3516 and stop loss is at 1.3372.


