Main Quotes Calendar Forum
flag

FX.co ★ Ichimoku cloud indicator analysis of USD/JPY for December 20, 2017

parent
Forex Analysis:::2017-12-20T08:18:51

Ichimoku cloud indicator analysis of USD/JPY for December 20, 2017

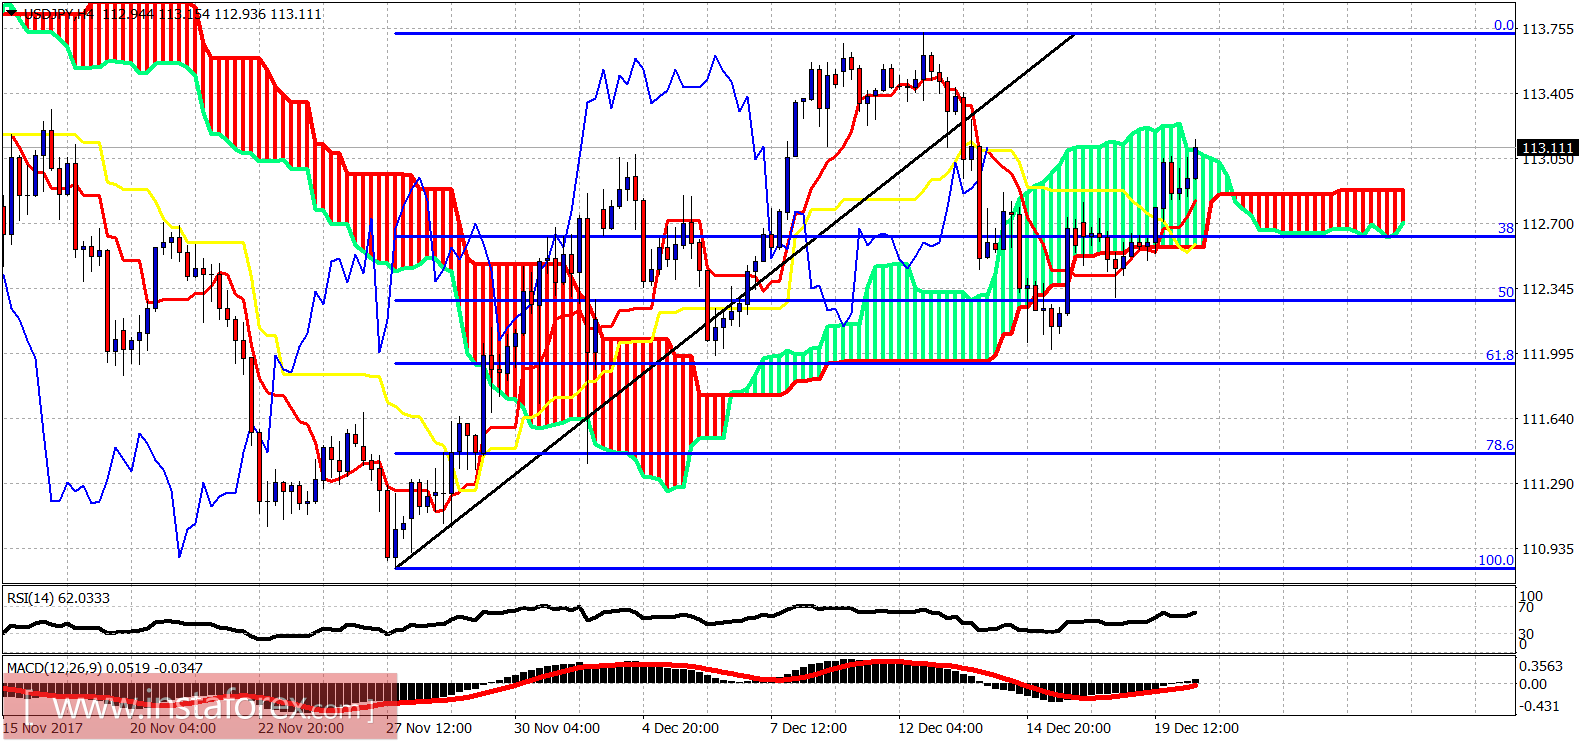
The USD/JPY pair is in a bullish trend. A short-term pullback has most probably finished at 112 and I'm now expecting a move towards 114.50-115. Confirmation for this will come with the daily close above 113.50.

Ichimoku cloud indicator analysis of USD/JPY for December 20, 2017

The USD/JPY pair has bounced off the 61.8% Fibonacci retracement as shown above in the 4-hour chart at the 112 price level. Price has not stayed for a long time below the 4-hour cloud and is now trying to break above it. A 4-hour close above 113.20 will be a bullish short-term sign. Price is making higher highs and higher lows. Support is at 112.33 and resistance at 113.20-113.30.

Ichimoku cloud indicator analysis of USD/JPY for December 20, 2017

Red line- resistance--

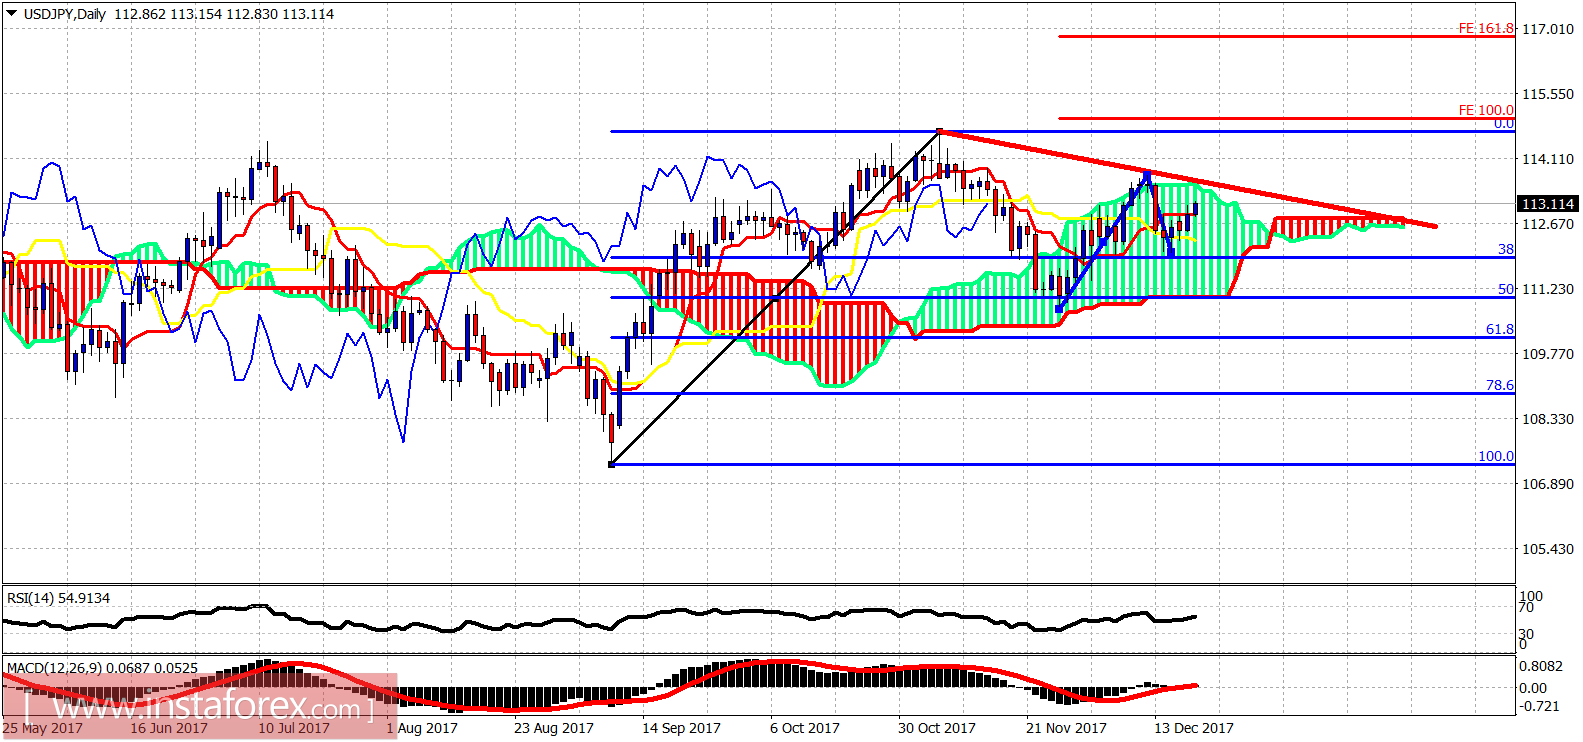
The USD/JPY pair is inside the Daily Kumo (cloud). Trend is neutral in the daily chart. The resistance trend line is at 113.20-113.30. If we close above it, I expect the equal extension of the first rise to push this second bullish wave towards 115. An extended rise will push price towards 117. Cloud resistance is the same in the daily chart with the trend line resistance. This increases the importance of the resistance level of 113.20-133.30.

Analyst InstaForex
Share this article:
parent
loader...
all-was_read__icon
You have watched all the best publications
presently.
We are already looking for something interesting for you...
all-was_read__star
Recently published:
loader...
More recent publications...