


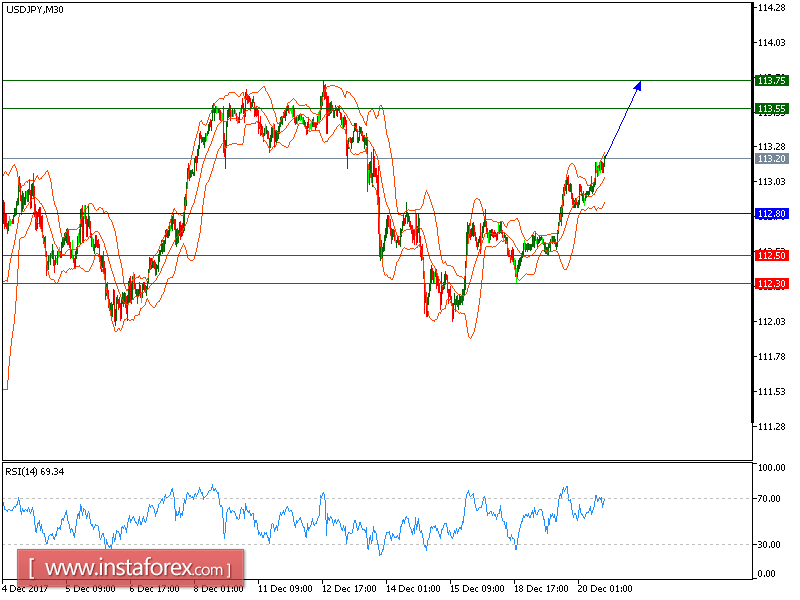
USD/JPY remains on the upside while trading around the ascending 20-period moving average, which stands above the 50-period one. Currently, it is not far away from the high of yesterday (December 19) at 113.07. And the relative strength index stays at levels above the neutrality level of 50, showing a lack of downward momentum for the pair. As long as the key support at 112.80 is not breached, the pair should return to 113.55 before advancing further to 113.75.
Alternatively, if the price moves in the opposite direction, a short position is recommended below 112.80 with a target of 112.50.
Chart Explanation: The black line shows the pivot point. The current price above the pivot point indicates a bullish position, while the price below the pivot point is a signal for a short position. The red lines show the support levels and the green line indicates the resistance level. These levels can be used to enter and exit trades.
Strategy: BUY, Stop Loss: 112.80, Take Profit: 113.55
Resistance levels: 113.55, 113.75 and 114.00 Support Levels: 112.50, 112.30, 112.00


