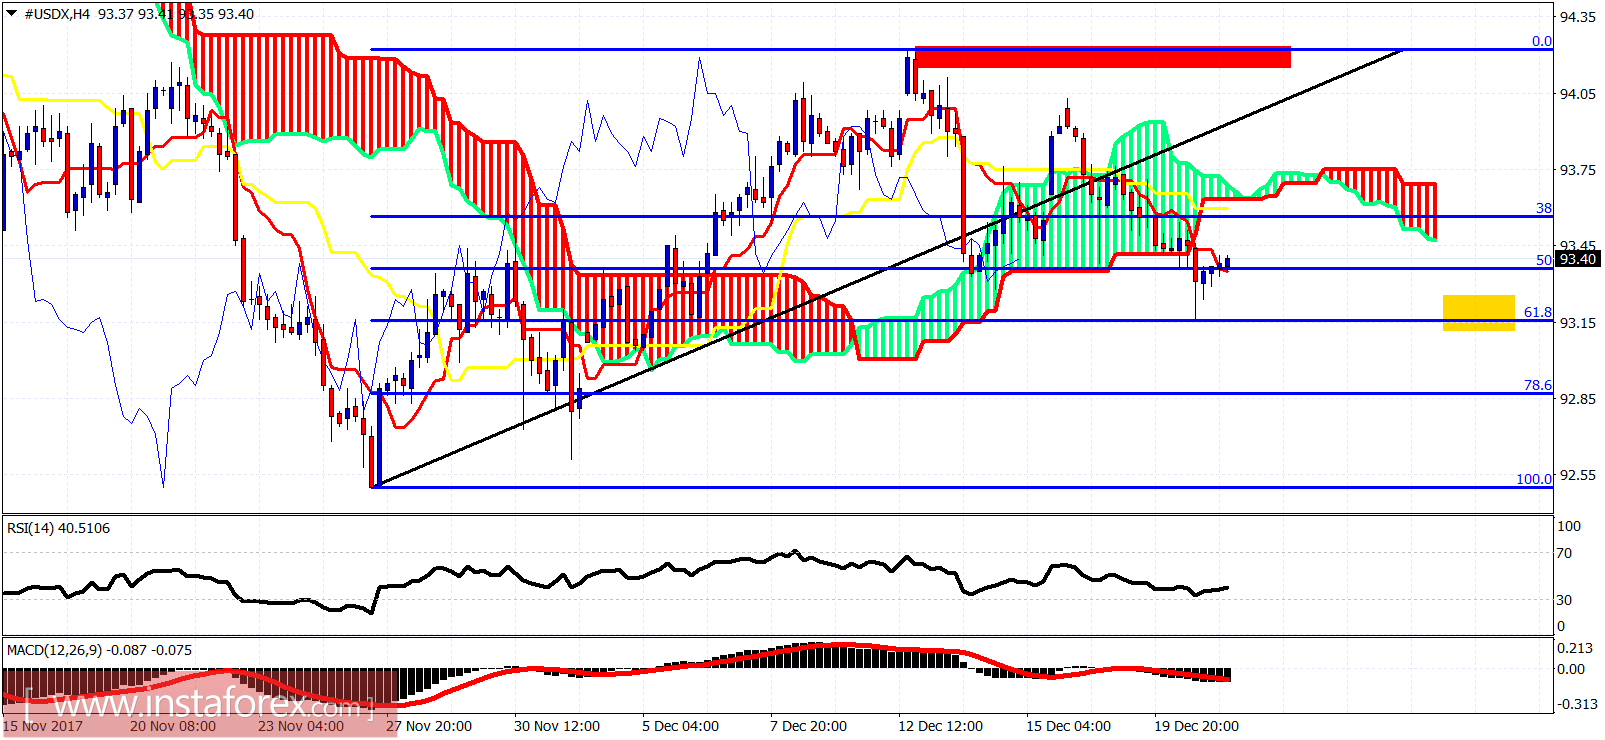
The Dollar index has broken through cloud support and short-term trend has changed to bearish. However price shows reversal signs off the 61.8% Fibonacci retracement. Last line of defense for bulls now is the 92.50 level. However bears have the upper hand as long as price is below 94-94.30.

The Dollar index is making lower lows and lower highs in the 4-hour chart. Price is below the cloud. Trend is bearish. Support is at 93.15 and resistance at 93.65.

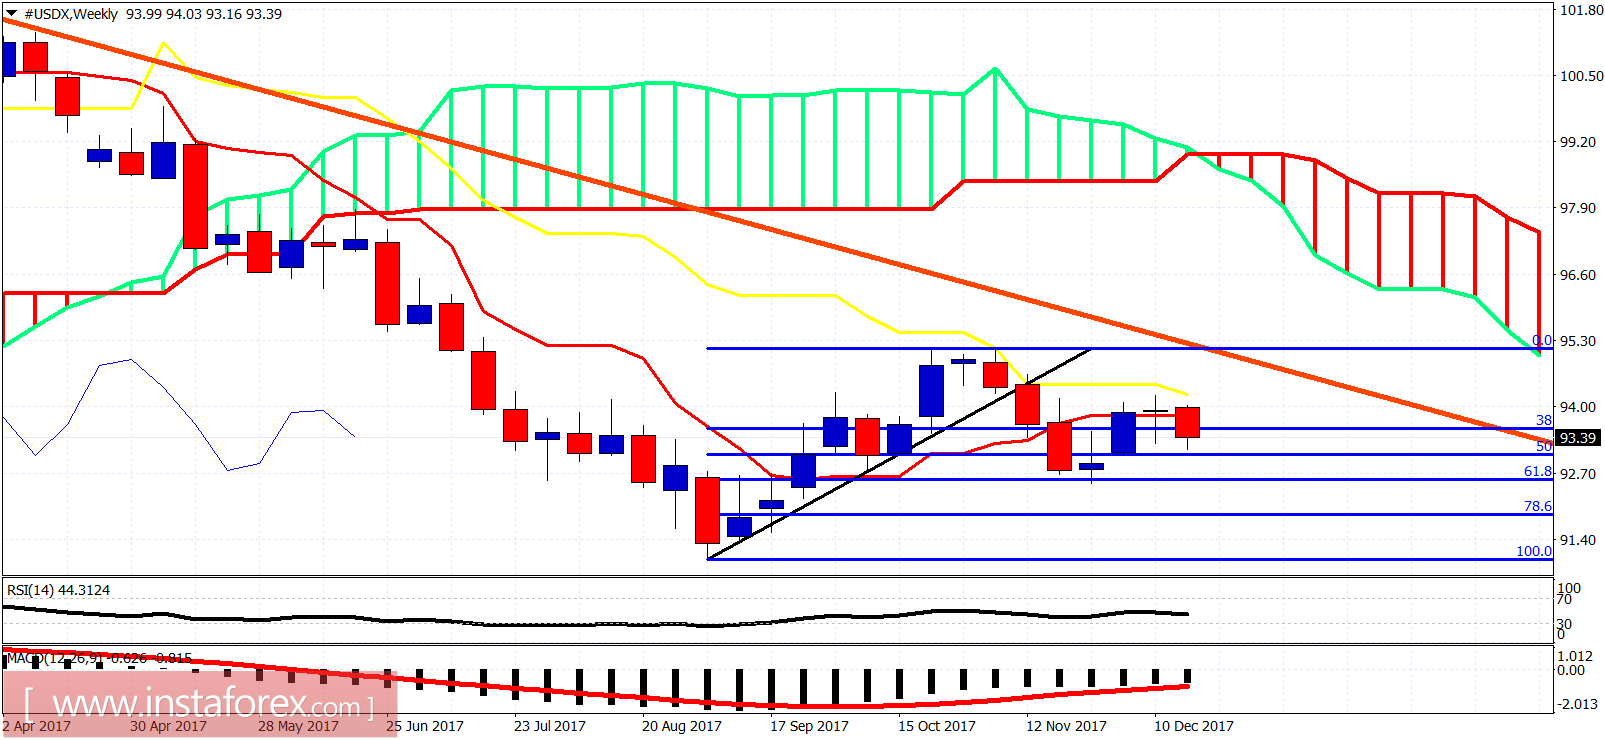
On a weekly basis, the weekly candle shows a rejection at the kijun- and tenkan-sen indicators. This is a bearish sign. However I expect the Dollar to strengthen today and tomorrow so we have to be patient to see how the weekly candle closes. A weekly close above 93.60 this week will be a positive sign for next week. I'm bullish the Dollar index.


