Main Quotes Calendar Forum
flag

FX.co ★ Ichimoku indicator analysis of gold for December 22, 2017

parent
Forex Analysis:::2017-12-22T07:45:27

Ichimoku indicator analysis of gold for December 22, 2017

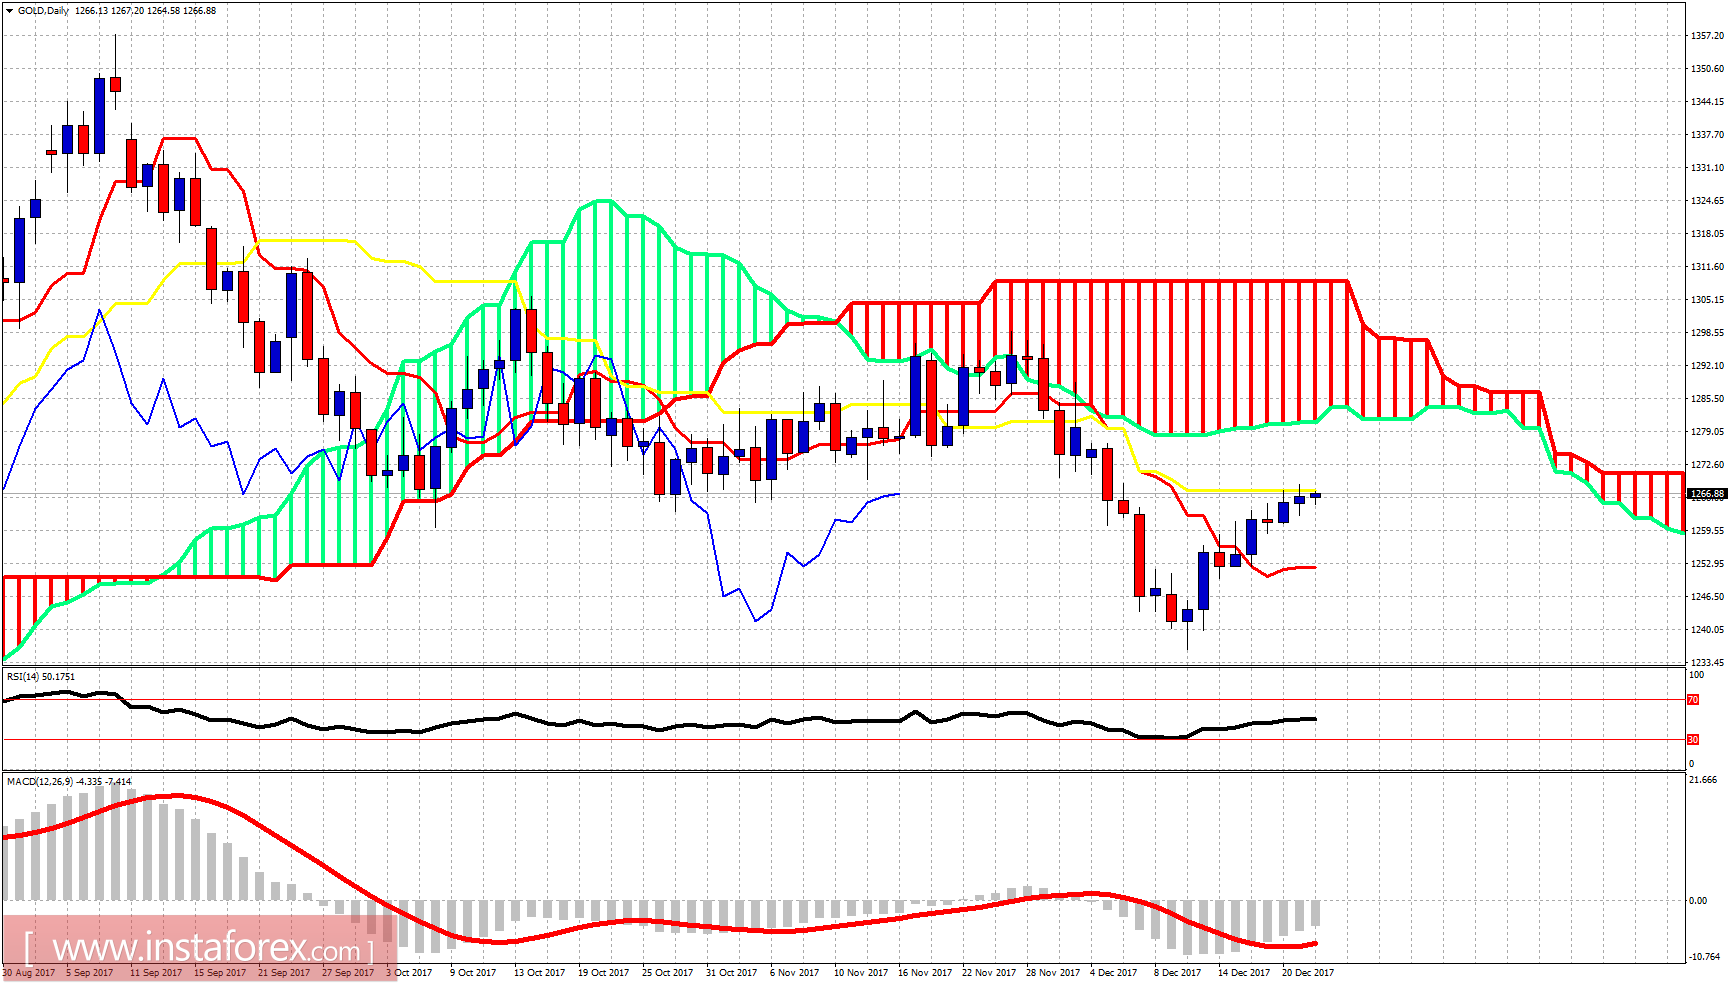
Gold price remains near the important $1,266-70 resistance area. Trend remains bullish but price has made no real progress over last few days. Gold price is expected to reverse and at least test support at $1,250. I'm bearish, expecting a move even towards $1,220.

Ichimoku indicator analysis of gold for December 22, 2017

Black lines - bearish wedge

Gold price is not moving higher in an impulsive pattern. Price although trading above the 4-hour Kumo (cloud) has formed a bearish wedge. Support is at $1,263 and at $1,260. Breaking below these levels will give me a new sell signal with $1,250 as minimum target. Price is right below the 61.8% Fibonacci retracement of the latest downward move and I'm bearish here.
Ichimoku indicator analysis of gold for December 22, 2017

In the daily chart, Gold price is testing the daily kijun-sen. This is very important resistance. A rejection at current levels will at least push price towards the daily tenkan-sen (red line indicator). However I believe it is more probable we break it and move to test recent lows at $1,240-37. Forming a higher low would be a bullish sign. That is why bears need to break below the tenkan-sen and weaken bulls further.
Analyst InstaForex
Share this article:
parent
loader...
all-was_read__icon
You have watched all the best publications
presently.
We are already looking for something interesting for you...
all-was_read__star
Recently published:
loader...
More recent publications...