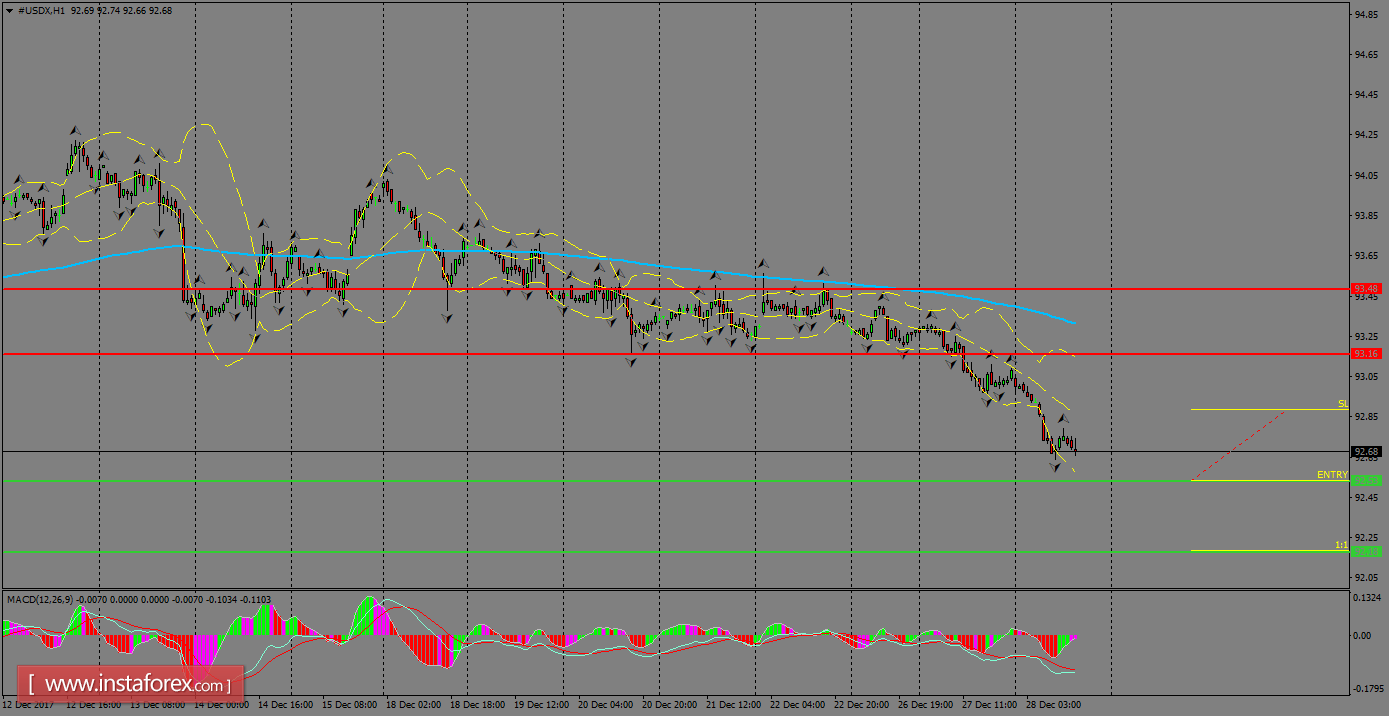
The index is plummeting strongly below the 200 SMA on H1 chart, facing support around 92.53. The lower band of Bollinger bands is being tested and should give up in order to allow an extension lower towards the support zone of 92.19. However, a rebound at the current stage cannot be discarded and it should help to correct the recent moves.

H1 chart's resistance levels: 93.16 / 93.48
H1 chart's support levels: 92.53 / 92.19
Trading recommendations for today: Based on the H1 chart, place sell (short) orders only if the USD Index breaks with a bearish candlestick; the support level is at 92.53, take profit is at 92.19 and stop loss is at 92.88.


