


Gold price has broken the triangle pattern we mentioned yesterday to the downside. As long as price is below $1,322 I expect Gold to move towards $1,290-80 at first. Gold short-term trend is changing to bearish. As said before, Gold is in a similar place when it was trading at $1,237 but from the bearish point of view.
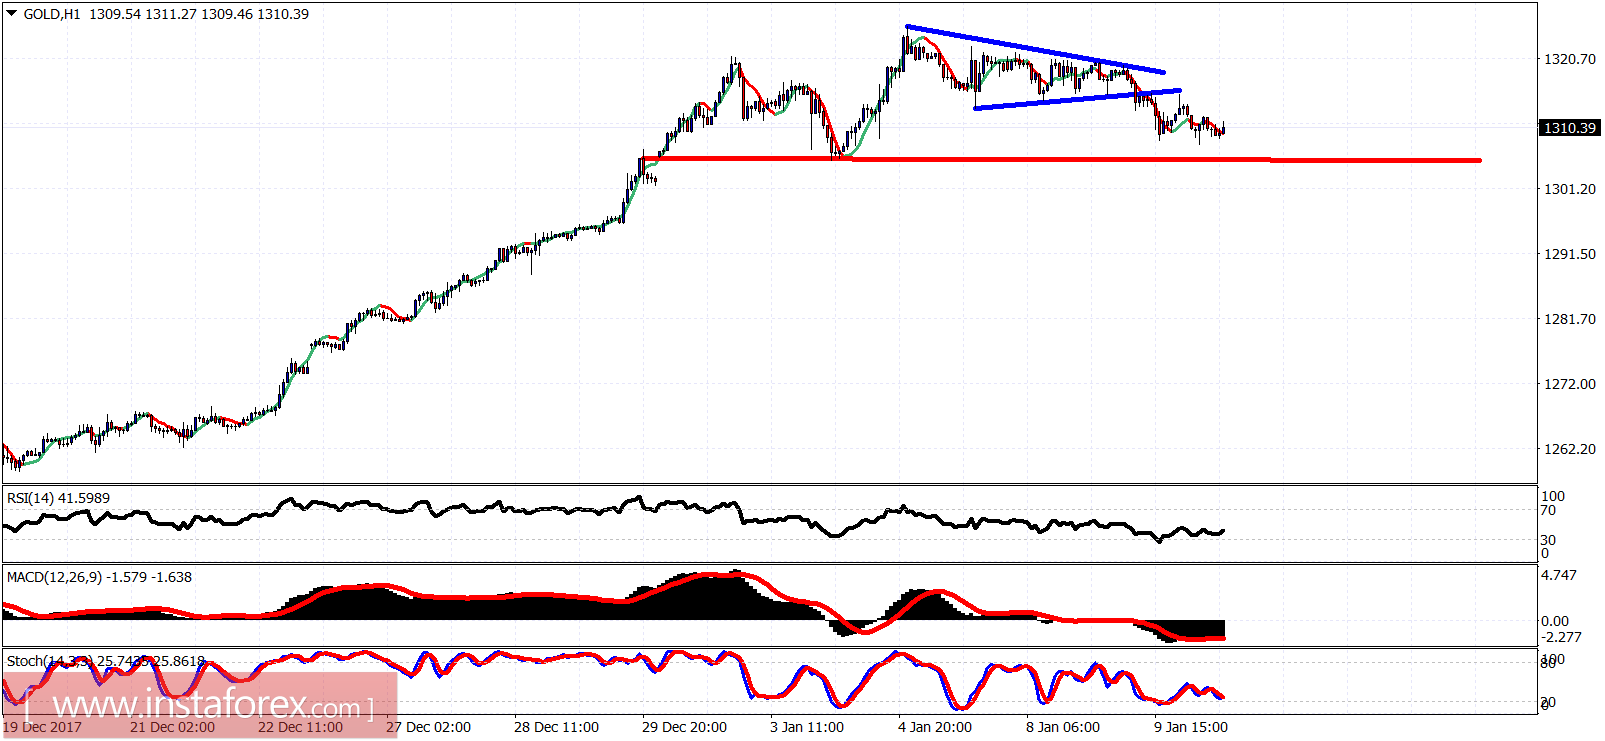
Red line - support
Gold price is near its highs but price has taken a downward turn. Price is making lower lows and lower highs in the 4-hour chart. The bearish divergence signs are finally proving themselves. Critical support is at $1,305. Breaking below that level will confirm our bearish view and accelerate the move lower.
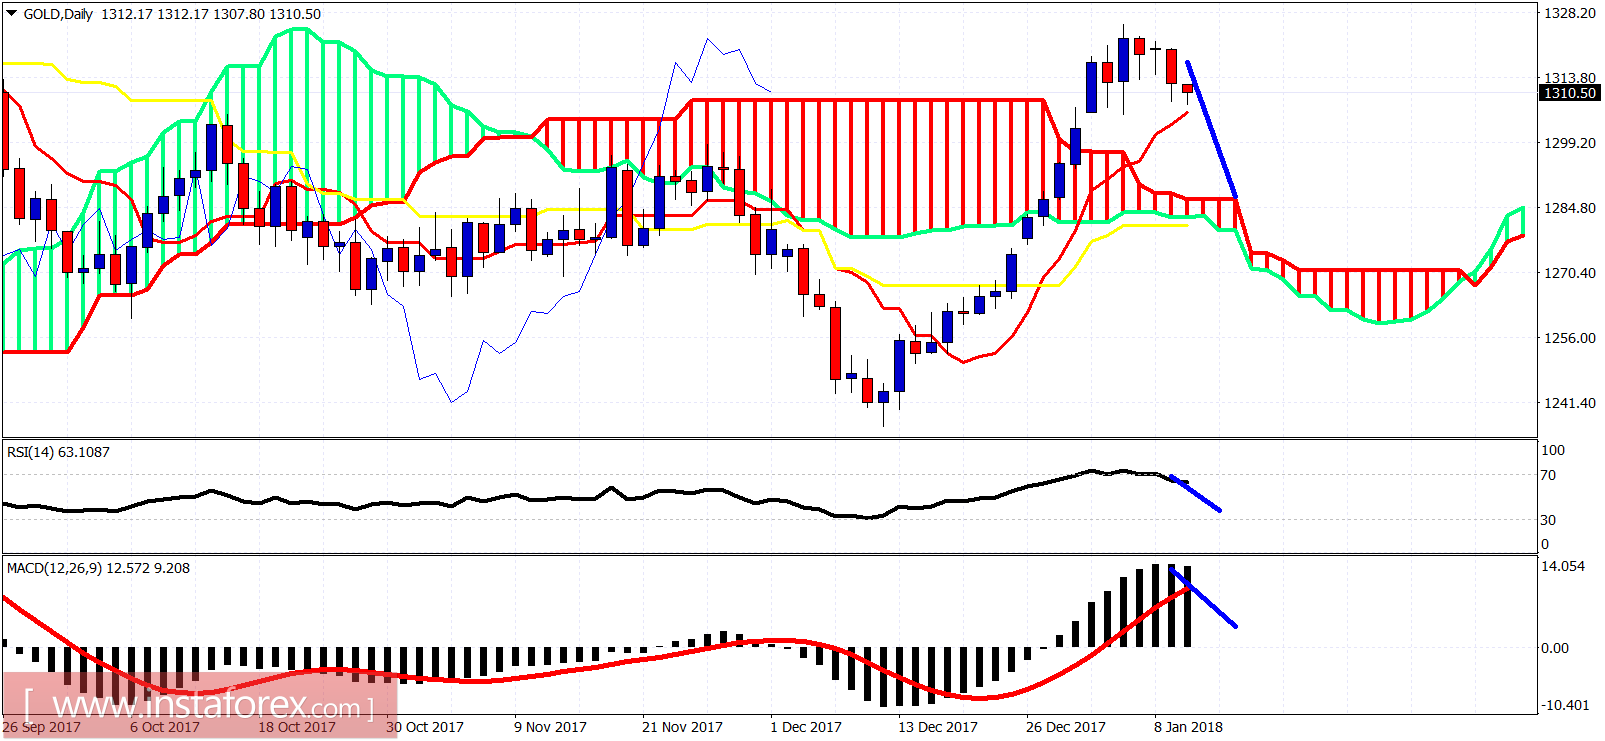
Gold price has broken out of the Daily cloud resistance and now I expect at least a back test of the broken cloud resistance back towards $1,285 at least. I'm bearish about Gold.


