


Gold price has pulled back from its recent highs at $1,344 as the bearish divergence signs suggested it would. It now remains to be seen how deep this pull back will be. Short-term trend remains bullish as long as price is above $1,309.
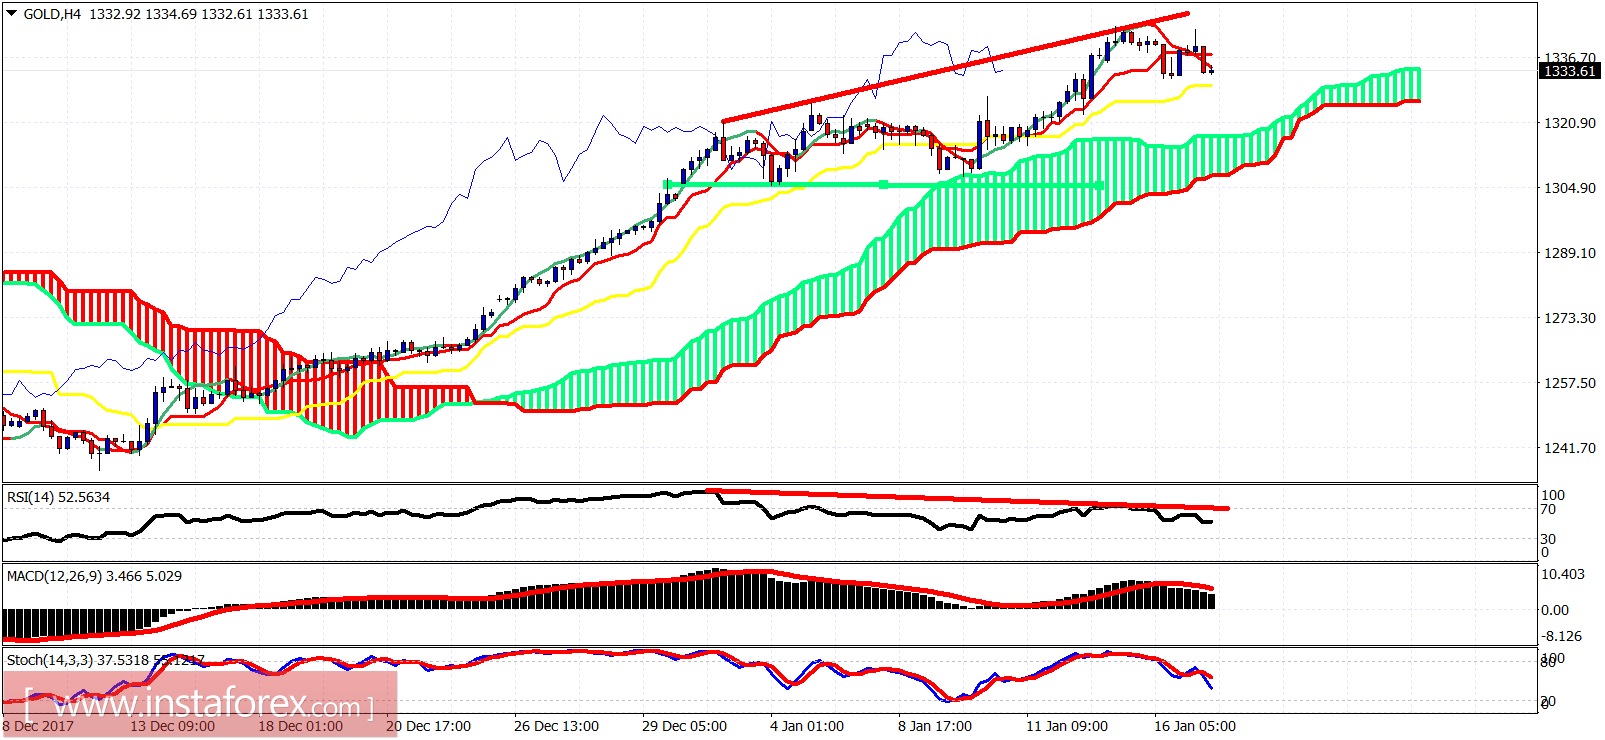
Green line - support
Short-term support is found at $1,325 and next at $1,316-$1,309. Price has most probably completed the entire rise from $1,237. It is time for a correction. Important levels to watch out for apart from $1,309 are at $1,280 and $1,250.
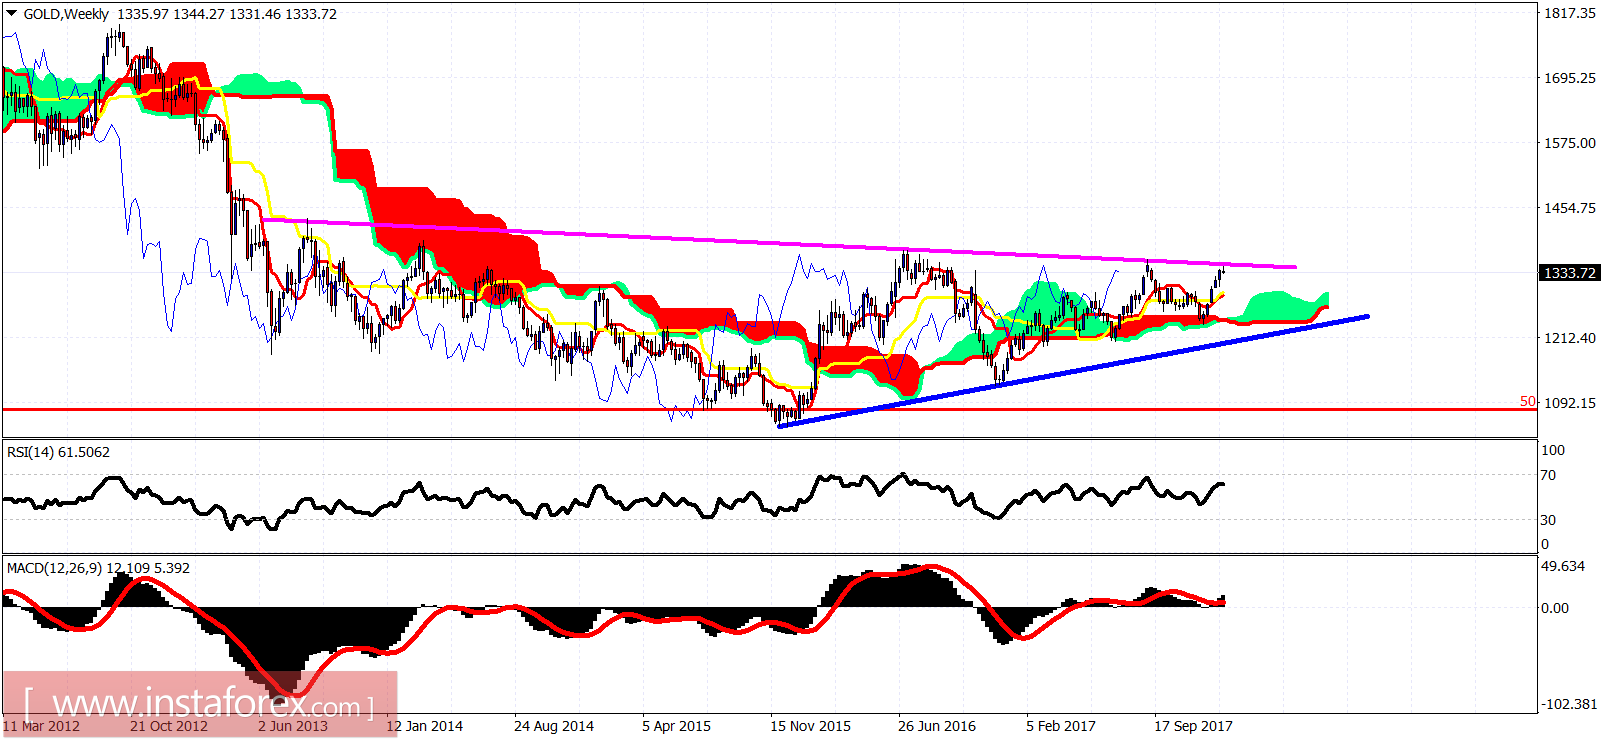
Magenta line - resistance
Blue line - support
On a weekly basis, we have come very close to the long-term resistance of $1,250. A rejection here will be a bearish sign. However only a weekly close below $1,290 could push price towards $1,250 where the Ichimoku cloud support is found or even towards the blue long-term trend line support at $1,210.


