


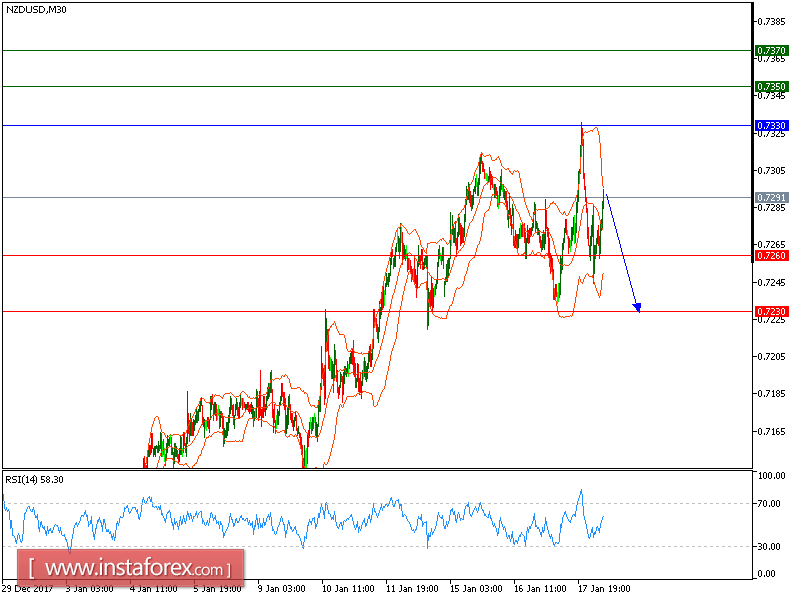
NZD/USD is consolidating. The pair posted an intraday "V-reversal" pattern yesterday and is likely to post some consolidations in sight. The relative strength index has broken below its neutrality area at 50 and is now mixed to bearish.
Therefore, as long as 0.7330 is resistance, expect a new pullback to 0.7260 and 0.7230 in extension.
The black line shows the pivot point. Currently, the price is above the pivot point, which is a signal for long positions. If it remains below the pivot point, it will indicate short positions. The red lines are showing the support levels, while the green line is indicating the resistance levels. These levels can be used to enter and exit trades.
Resistance levels: 0.7350, 0.7370, and 0.7385.
Support levels: 0.7260, 0.7230, and 0.7200.


