


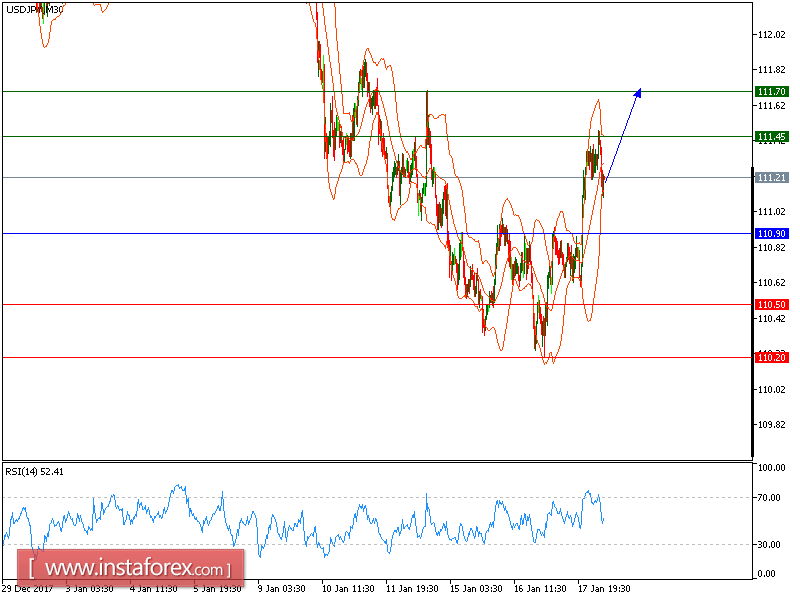
USD/JPY is expected to trade with a bullish outlook. The pair shows an upward momentum after breaking above the declining trend line since January 15. Both rising 20-period and 50-period moving averages maintain the bullish bias. The relative strength index advocates for a further upside.
Hence, above 110.90, look for a new advance with targets at 111.45 and 111.70 in extension.
Alternatively, if the price moves in the opposite direction, a short position is recommended below 110.90 with a target of 110.50.
Chart Explanation: The black line shows the pivot point. The current price above the pivot point indicates a bullish position, while the price below the pivot point is a signal for a short position. The red lines show the support levels and the green line indicates the resistance level. These levels can be used to enter and exit trades.
Strategy: BUY, stop loss at 110.90, take profit at 111.45.
Resistance levels: 111.45, 111.70, and 112.05
Support levels: 110.50, 110.20, and 109.65.


