


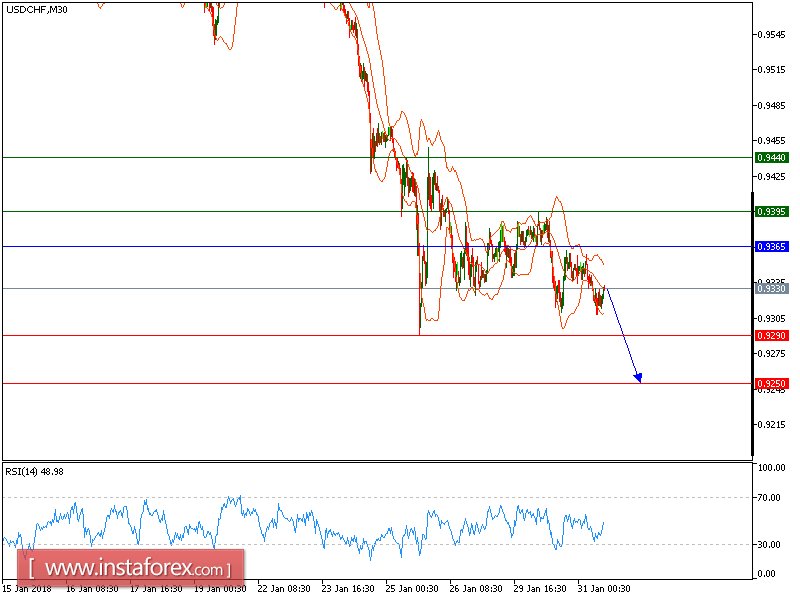
USD/CHF is under pressure. Despite the recent rebound from 0.9305, the pair is still capped by a declining 50-period moving average. The relative strength index is mixed with a bearish bias. Even though a continuation of the technical rebound cannot be ruled out, its extent should be limited.
To sum up, as long as 0.9365 is not surpassed, look for a new drop with targets at 0.9290 and 0.9250 in extension.
Chart Explanation: The black line shows the pivot point. The present price above the pivot point indicates a bullish position, and the price below the pivot point indicates a short position. The red lines show the support levels, and the green line indicates the resistance levels. These levels can be used to enter and exit trades.
Strategy: SELL, stop loss at 0.9365, take profit at 0.9290.
Resistance levels: 0.9395, 0.9440, and 0.9500
Support levels: 0.9290, 0.9250, and 0.9200.


