


Gold price made a new low and revisited its highs next after the FOMC. So far, it is trading in a range between $1,350-$1,330. A break out will give a big move towards $1,300-$1,280 or $1,400.
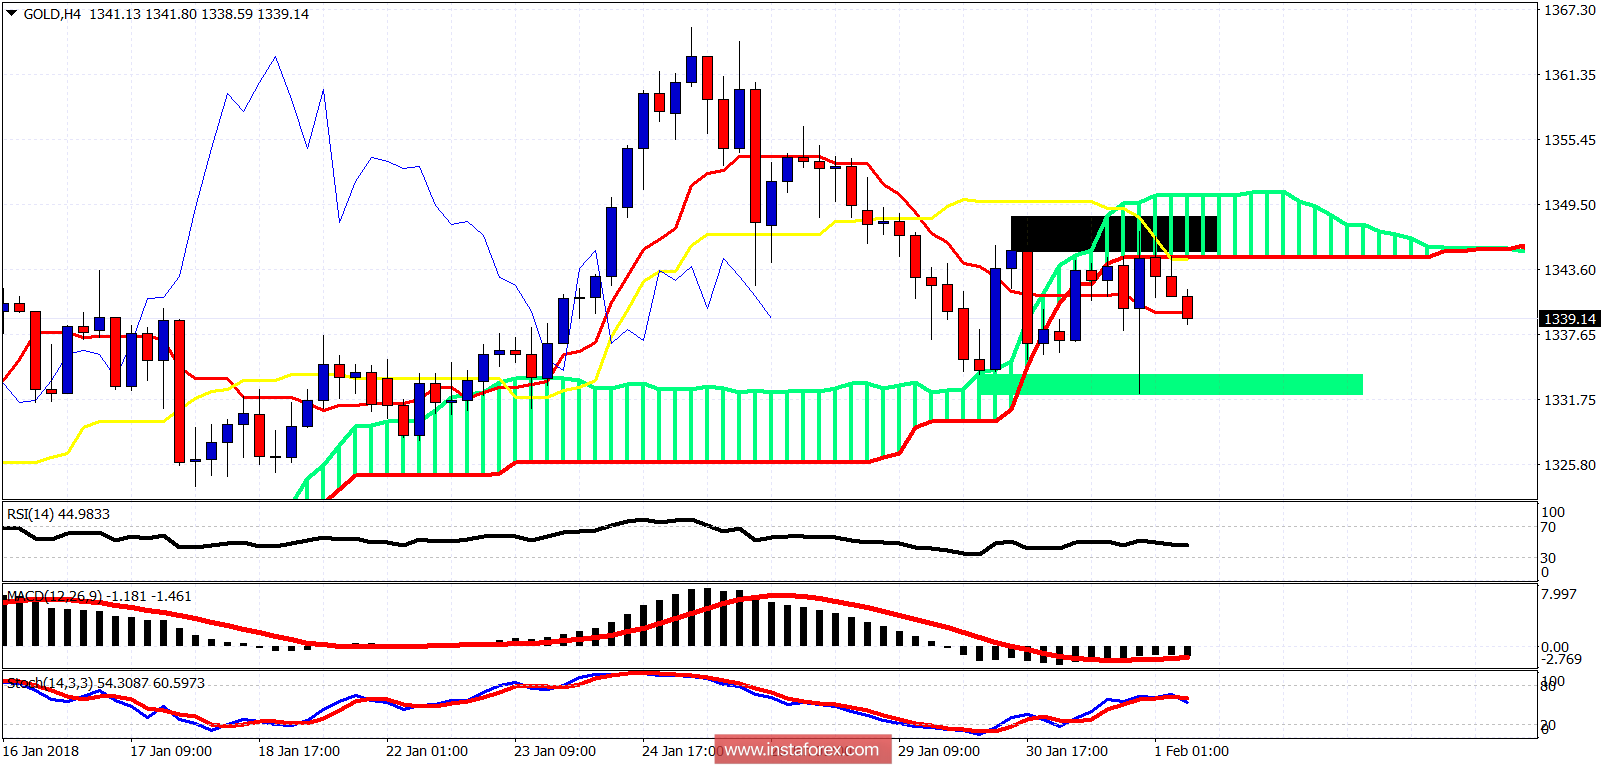
Black rectangle - resistance
Green rectangle - support
Gold price is trading below the 4 hour Kumo. Bears have the upper hand now, as long as price is below $1,344. Above the short-term resistance of $1,347 we should see a move to $1,358 first and then maybe to $1,380-$1,400. Break below support we should see a move towards $1,300.
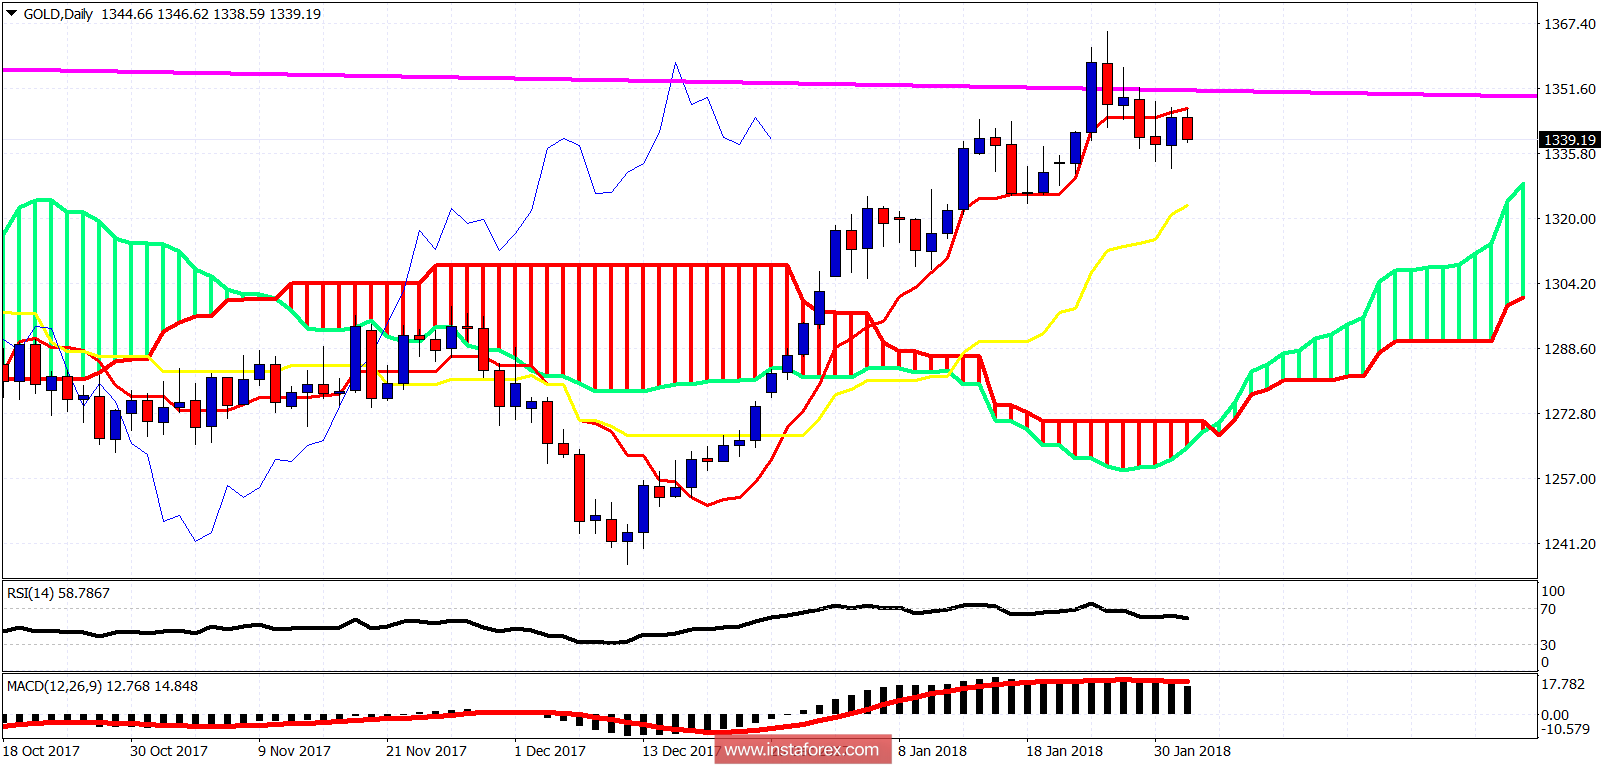
Magenta line - long-term resistance
Gold price remains below the long-term resistance and the daily tenkan-sen. A daily close above the tenkan-sen at $1,347 will open the way for new highs. Support is at $1,323. Breaking below it will push price towards the cloud support at $1,290.


