


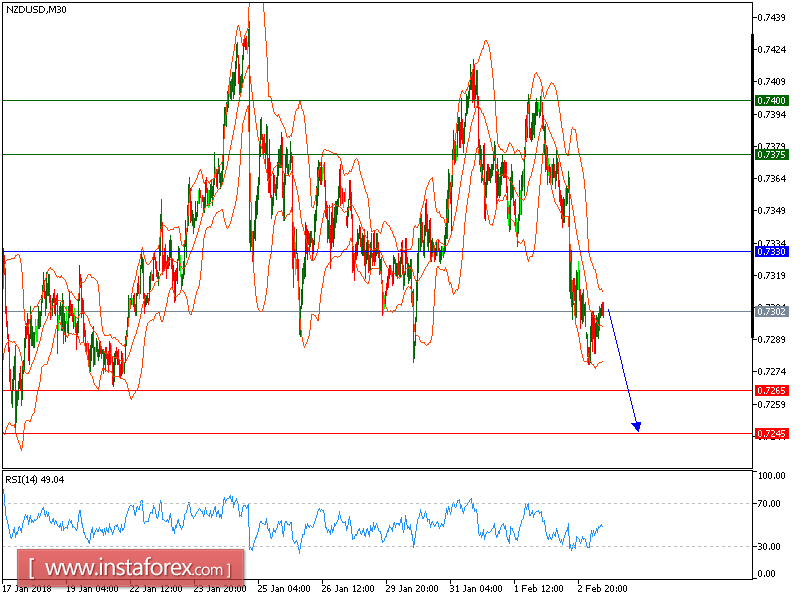
All our downside targets which we predicted in previous analysis have been hit. NZD/USD is expected to move further down. The pair broke below the lower boundary of Bollinger Bands after opening with a bearish gap, which indicated the acceleration on the downside. Both declining 20-period and 50-period moving averages should push the prices lower. The relative strength index is capped by a falling trend line since February 1.
Therefore, below 0.7330, look for a new test with targets at 0.7265 and 0.7245 in extension.
The black line shows the pivot point. Currently, the price is above the pivot point, which is a signal for long positions. If it remains below the pivot point, it will indicate short positions. The red lines show the support levels, while the green line indicates the resistance levels. These levels can be used to enter and exit trades.
Resistance levels: 0.7375, 0.7400, and 0.7450.
Support levels: 0.7265, 0.7245, and 0.7200.


