


GBP/USD plummeted during Monday's session and it allowed to make a bearish consolidation below the 200 SMA at H1 chart. The nearest support lies at 1.3937, at which a rebound should take the pair to test the 1.4078 level once again. On the downside, a break below 1.3937 should expose the 1.3850 area.
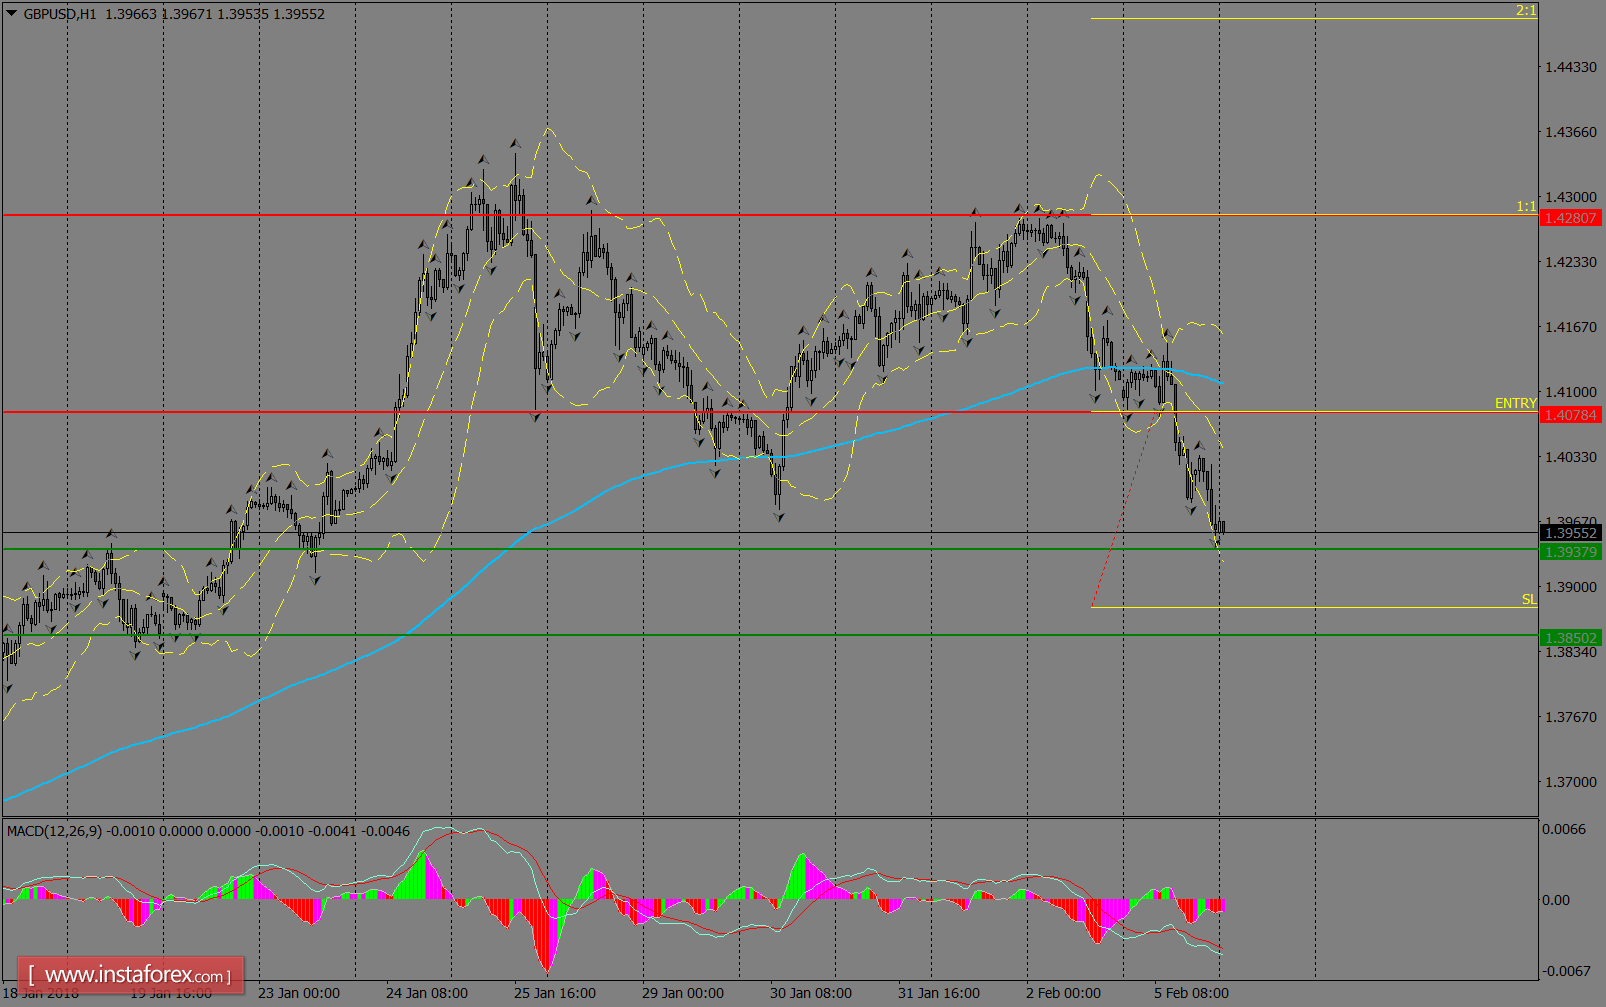
H1 chart's resistance levels: 1.4078 / 1.4280
H1 chart's support levels: 1.3937 / 1.3850
Trading recommendations for today: Based on the H1 chart, buy (long) orders only if the GBP/USD pair breaks a bullish candlestick; the resistance level is at 1.4078, take profit is at 1.4280 and stop loss is at 1.3878.


