


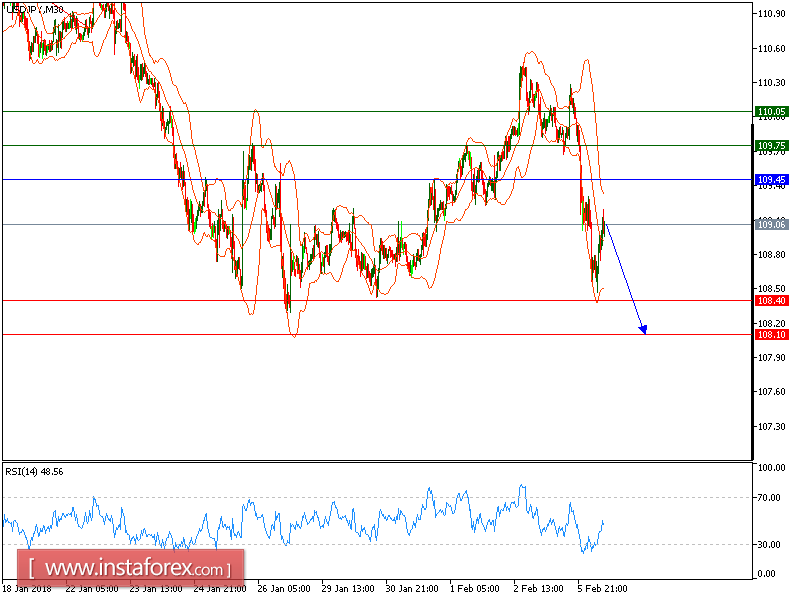
USD/JPY is under pressure. The pair keeps trading on the downside and around the lower Bollinger band. Very strong downward momentum is indicated by the relative strength index, which has broken below the over-sold level of 30 while showing no signs of a bullish divergence. Intraday bearishness persists, and a break below the immediate support at 108.40 would trigger a further drop toward 108.10.
Alternatively, if the price moves in the opposite direction, a Short position is recommended to be below 109.45 with a target of 109.75.
Chart Explanation: The black line shows the pivot point. The current price above the pivot point indicates a bullish position, while the price below the pivot point is a signal for a short position. The red lines show the support levels, and the green line indicates the resistance level. These levels can be used to enter and exit trades.
Strategy: BUY, stop loss at 109.45, take profit at 109.75.
Resistance levels: 109.75, 110.75, and 111.00
Support levels: 108.40, 108.10, and 107.75.


