


The pair comatose below the 200 SMA at the H1 chart and remains well supported by the 1.3753 level across the board. Cable could perform a break of such bottom area in order to reach the 1.3604 zone, at which could gather momentum to make a rebound as a corrective move. MACD indicator lacks direction, but still stays in the positive territory, supporting to the bulls in the short-term.
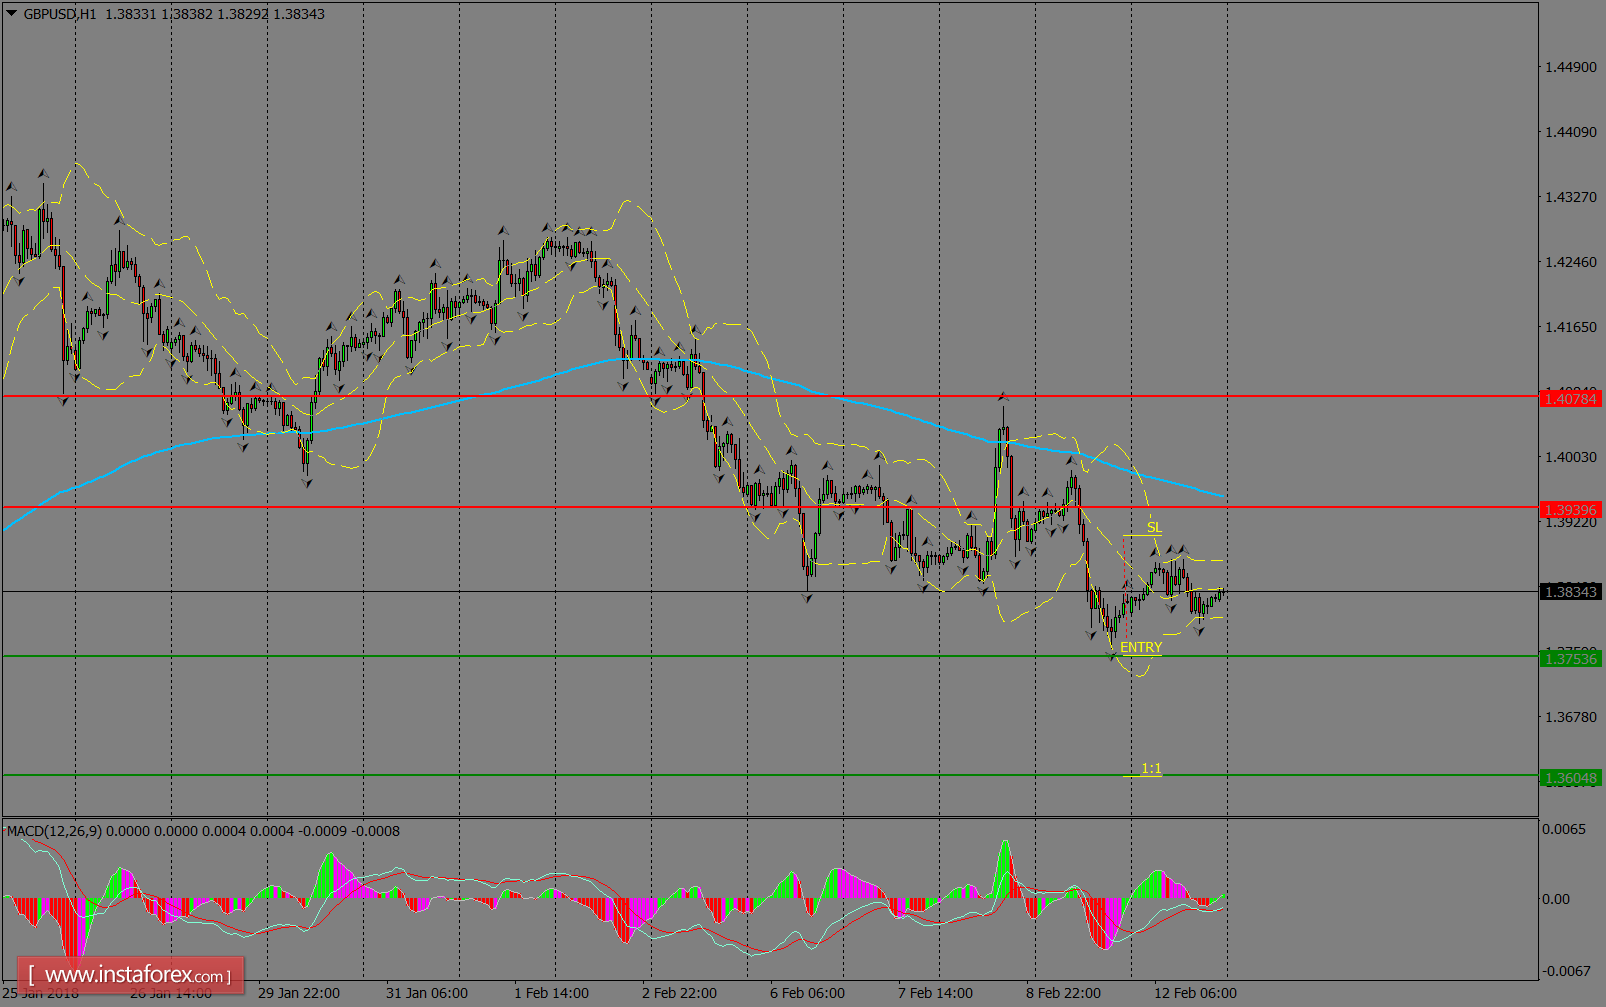
H1 chart's resistance levels: 1.3939 / 1.4078
H1 chart's support levels: 1.3753 / 1.3604
Trading recommendations for today: Based on the H1 chart, sell (short) orders only if the GBP/USD pair breaks a bearish candlestick; the resistance level is at 1.3753, take profit is at 1.3604 and stop loss is at 1.3903.


