


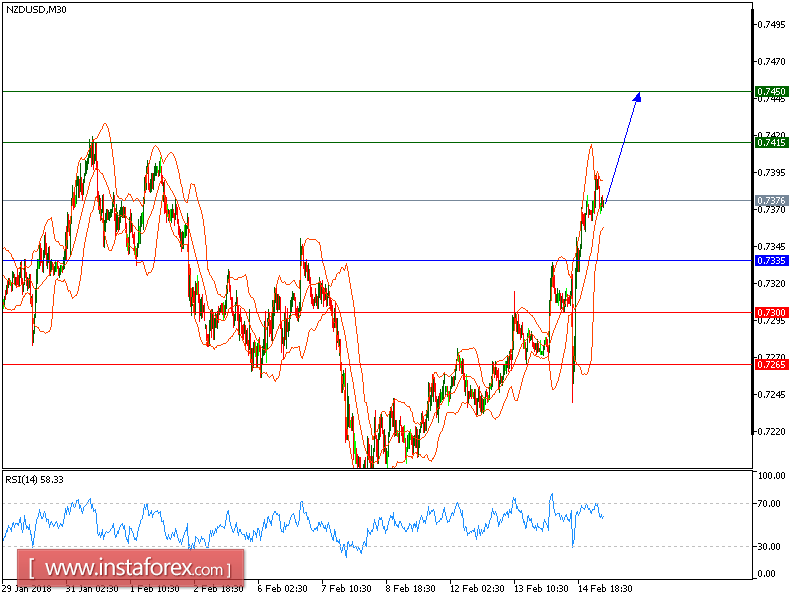
All our upside targets which we predicted in previous analysis have been hit precisely as we forecasted. NZD/USD is still trading on upside. The pair is trading above its rising 20-period and 50-period moving averages, which play support roles and maintain the upside bias. The relative strength index advocates for a further upside.
To conclude, as long as 0.7335 is not broken, look for a new rise with targets at 0.7415 and 0.7450 in extension.
The black line shows the pivot point. Currently, the price is above the pivot point, which is a signal for long positions. If it remains below the pivot point, it will indicate short positions. The red lines show the support levels, while the green line indicates the resistance levels. These levels can be used to enter and exit trades.
Resistance levels: 0.7325, 0.7355, and 0.7385.
Support levels: 0.7225, 0.7200, and 0.7175.


